
Colleges across the country welcomed 19.3 million undergraduate students in Fall 2024. That's 8.43% down from the peak enrollment rate in 2010. This stat shows that the way students approach higher education has changed in the face of increasing tuition costs and new learning formats.
If you're a student trying to figure out your next steps after high school, this article will walk you through the latest college enrollment statistics so you can have some context for what others are doing.
Enrolling and staying in college are one thing, though. Staying on top of your assignments is a bit trickier than that. When assignments pile up and your schedule gets tighter, professional help from EssayService's writers can truly be irreplaceable.

College Enrollment Statistics: Main Insights
Even though college enrollment trends point to a steady interest in full-time studies, it's also clear that the decisions are changing:
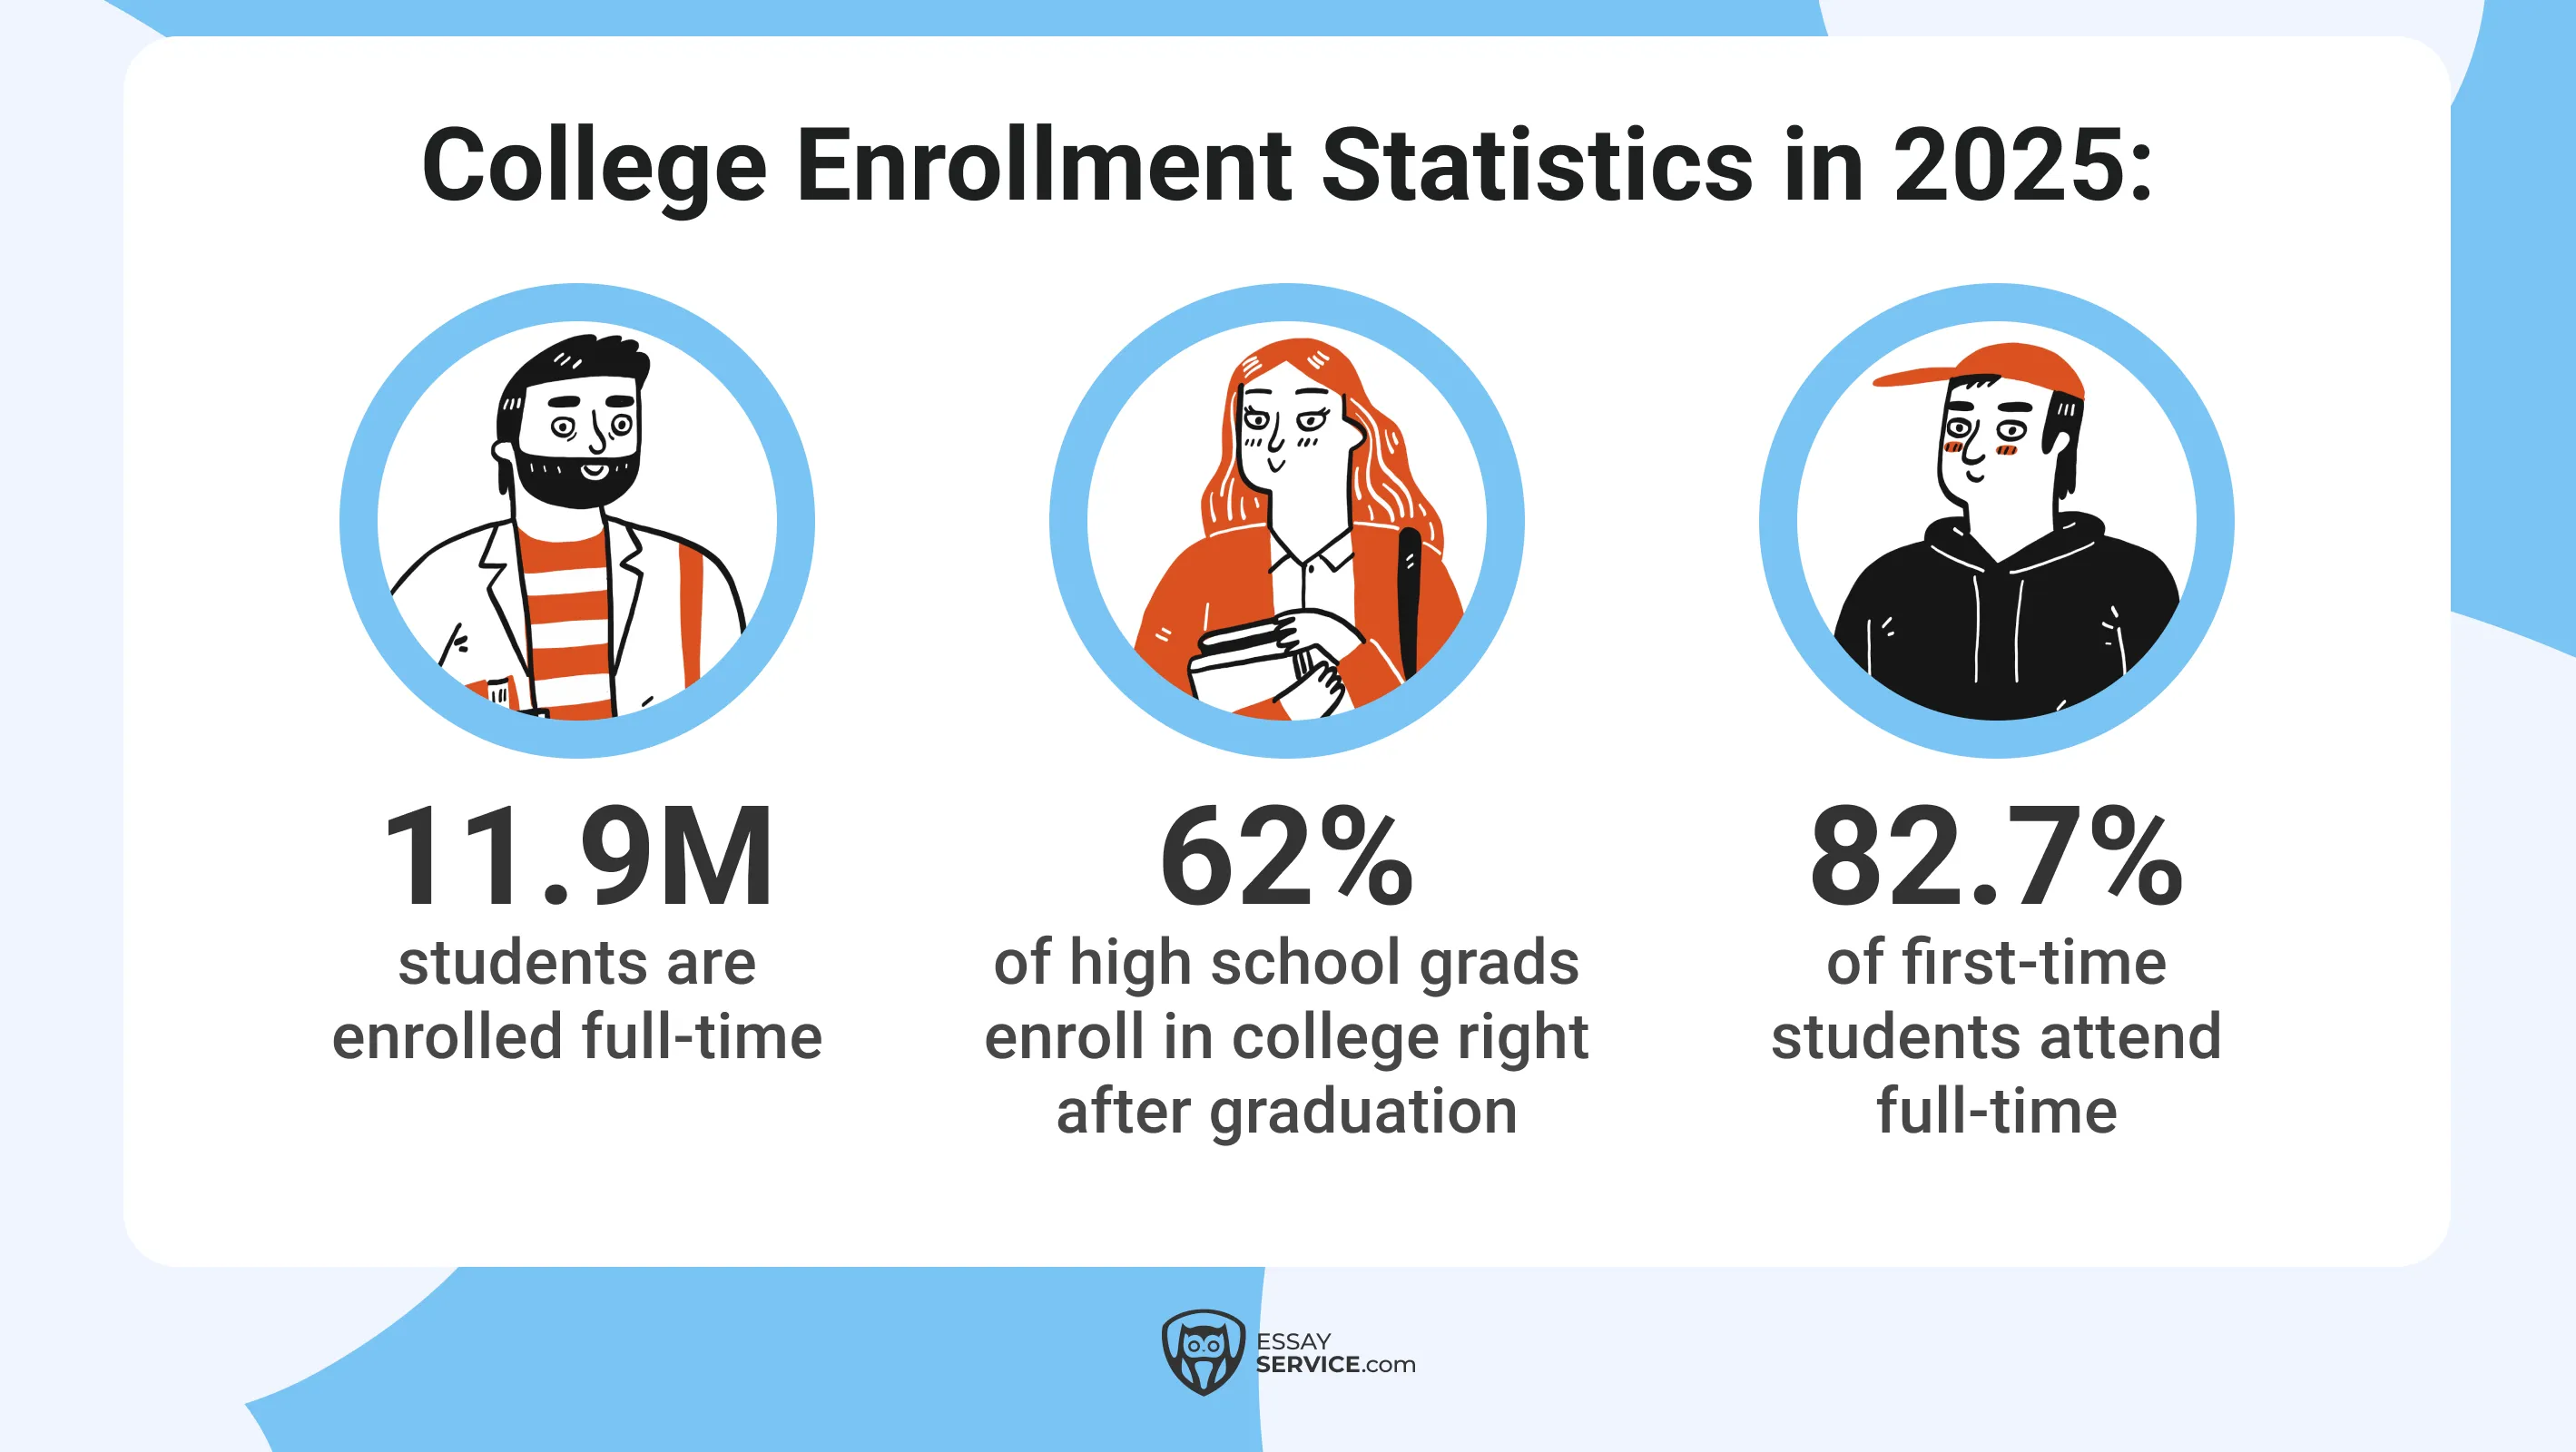
- 11.9 million students are enrolled full-time. That’s about 60% of all college students.
- 62% of high school grads go straight to college. In 2009, that number was 70.1%.
- 82.7% of first-time students are attending full-time.
College Enrollment by Institution Type
The kind of school students attend makes a big difference in how they experience college.
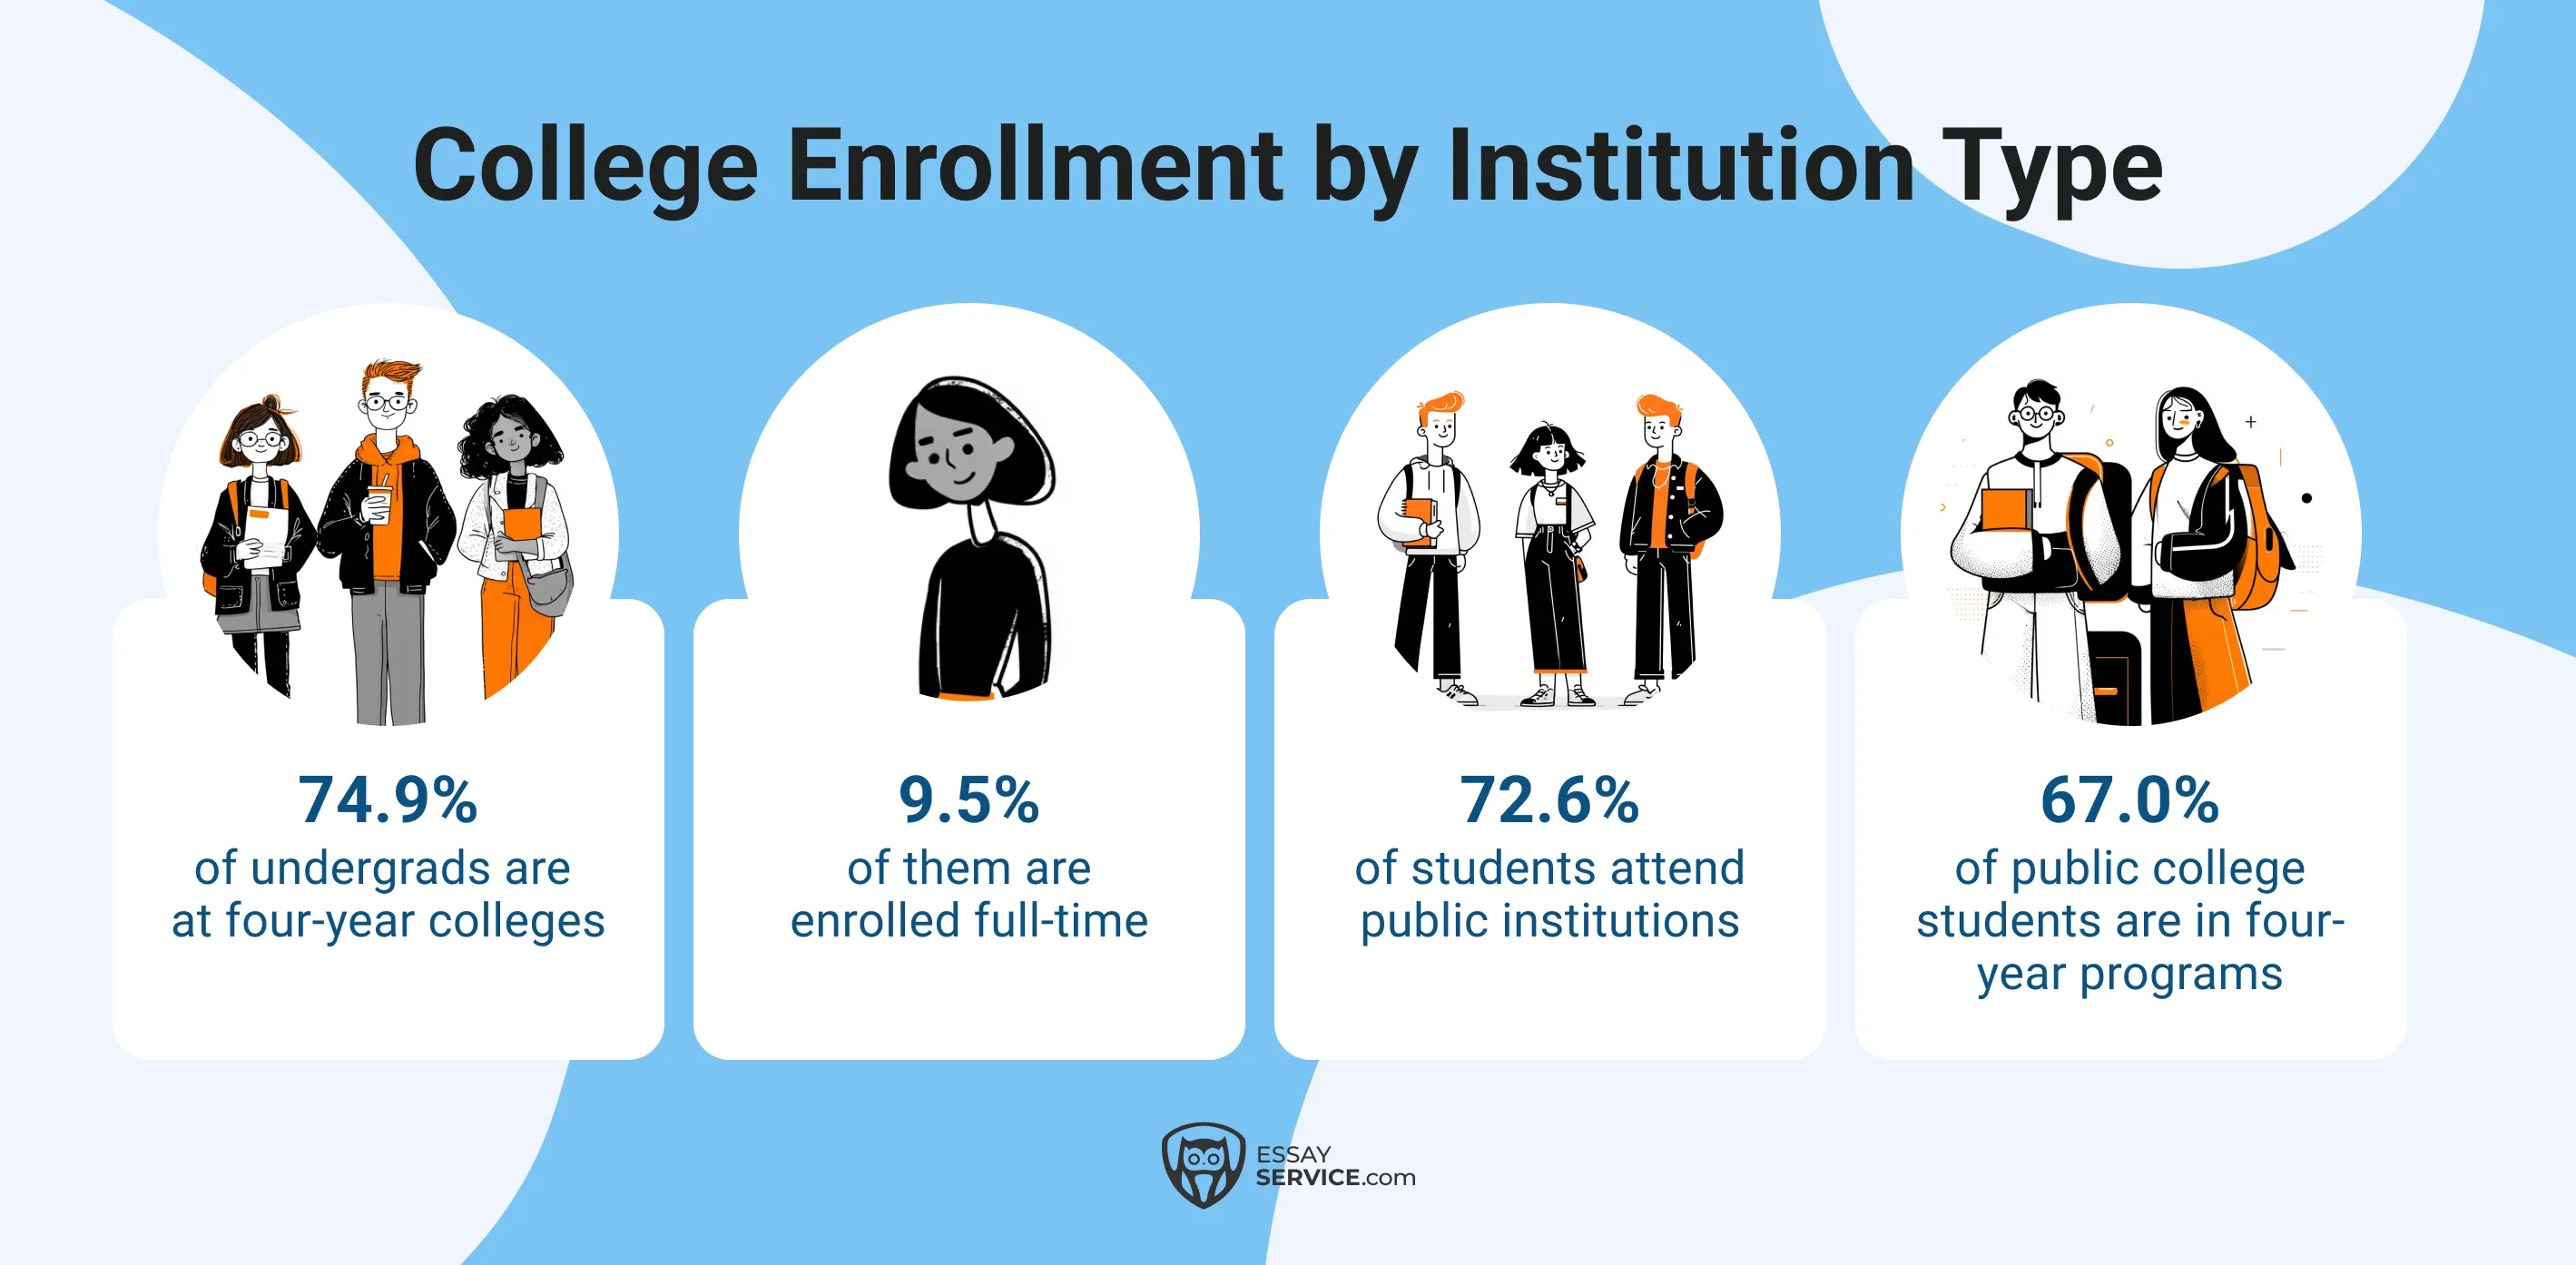
- About 74.9% of undergraduates are studying at four-year colleges and universities.
- Within that group, 69.5% are enrolled full-time
- 72.6% of all undergrads are attending public institutions this year.
- Of those public school students, 67.0% are enrolled in four-year degree programs.
Most students are still leaning toward full-time study at public four-year schools. This college enrollment rate shows that traditional degree programs still hold value. Long-term goals matter to undergrads, but affordability and practical concerns are usually what play a bigger role.
College Enrollment by Degree Level
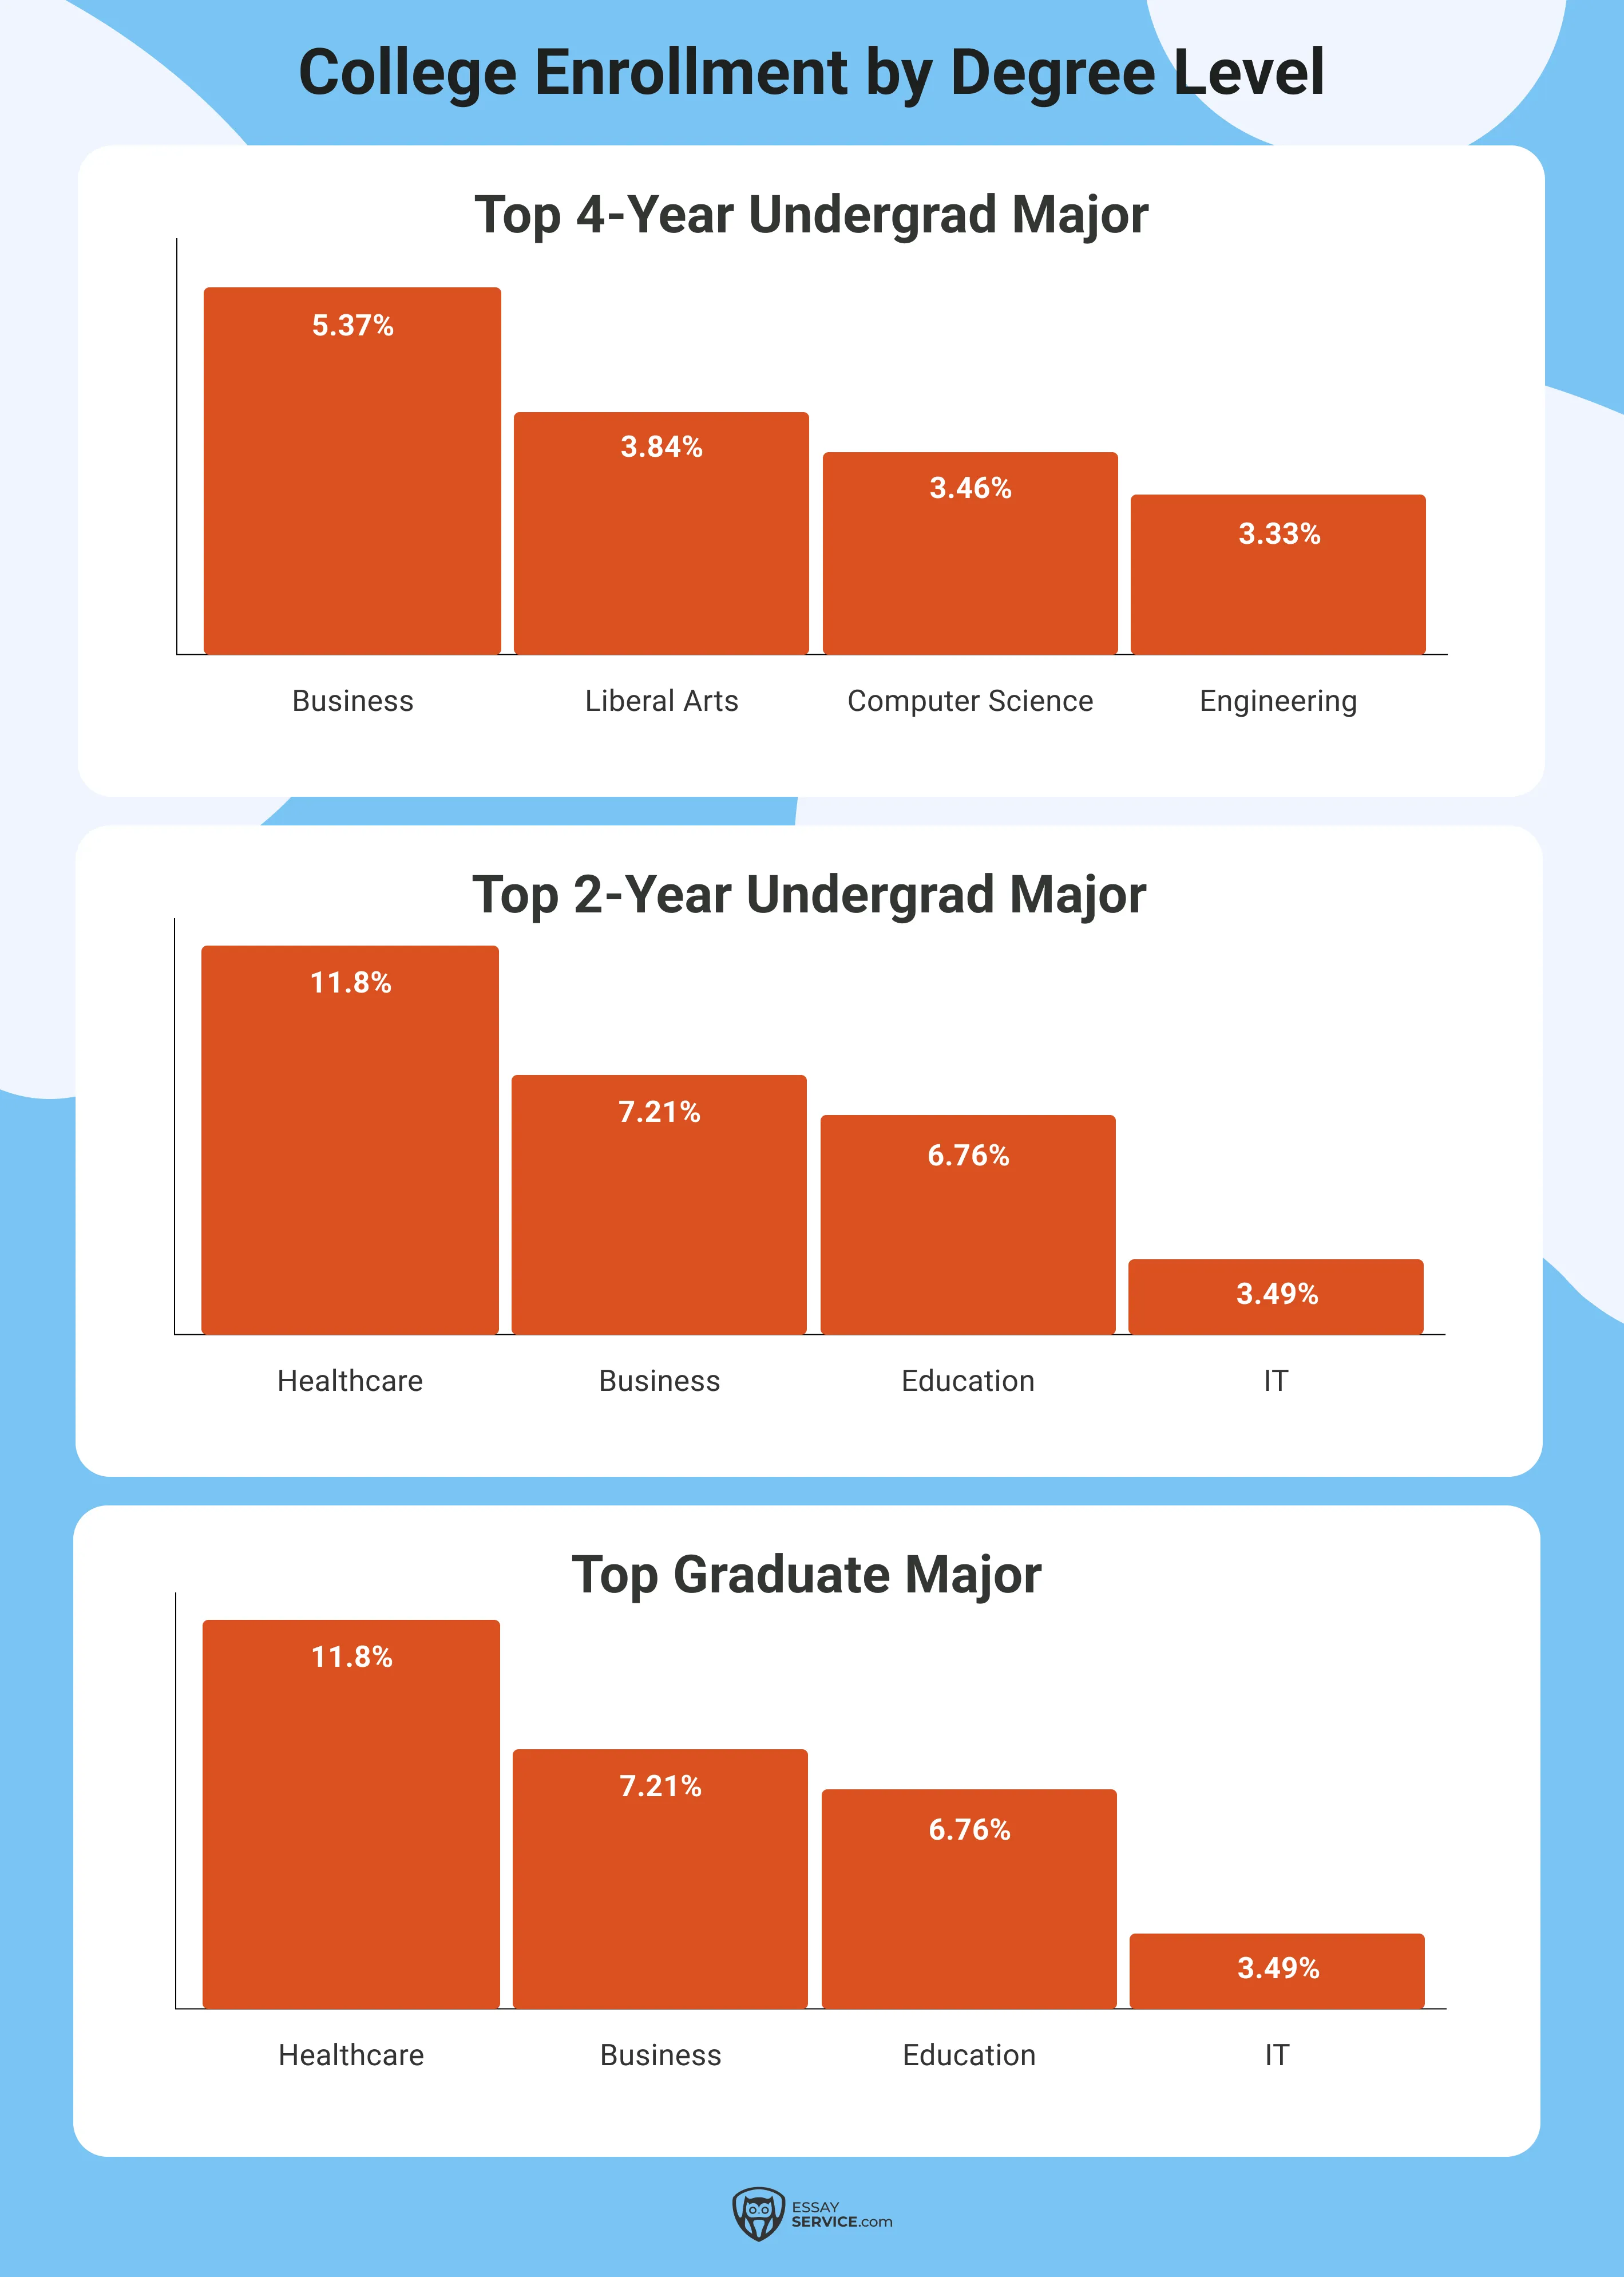
Students still favor graduate programs that are useful in the real world. The numbers below tell us that the enrolled college students are looking for degrees that offer stability and those with clear job prospects.
It's clear that students are thinking ahead. Business programs continue to draw large numbers, especially at four-year schools. Healthcare is the top choice at the graduate level, reflecting the fact that professionals are constantly in demand in this field. Even in two-year graduate programs, students are picking majors that connect directly to jobs.
College Enrollment Statistics by Demographics
College enrollment rate looks different depending on who you’re looking at. Age, gender, and race all play a part in who’s going to college and how that’s changed over time.
College Enrollment by Gender
The gap between male and female enrollment has only widened recently. Women are earning more degrees and generally making up a larger share of both undergrad and graduate student demographics.
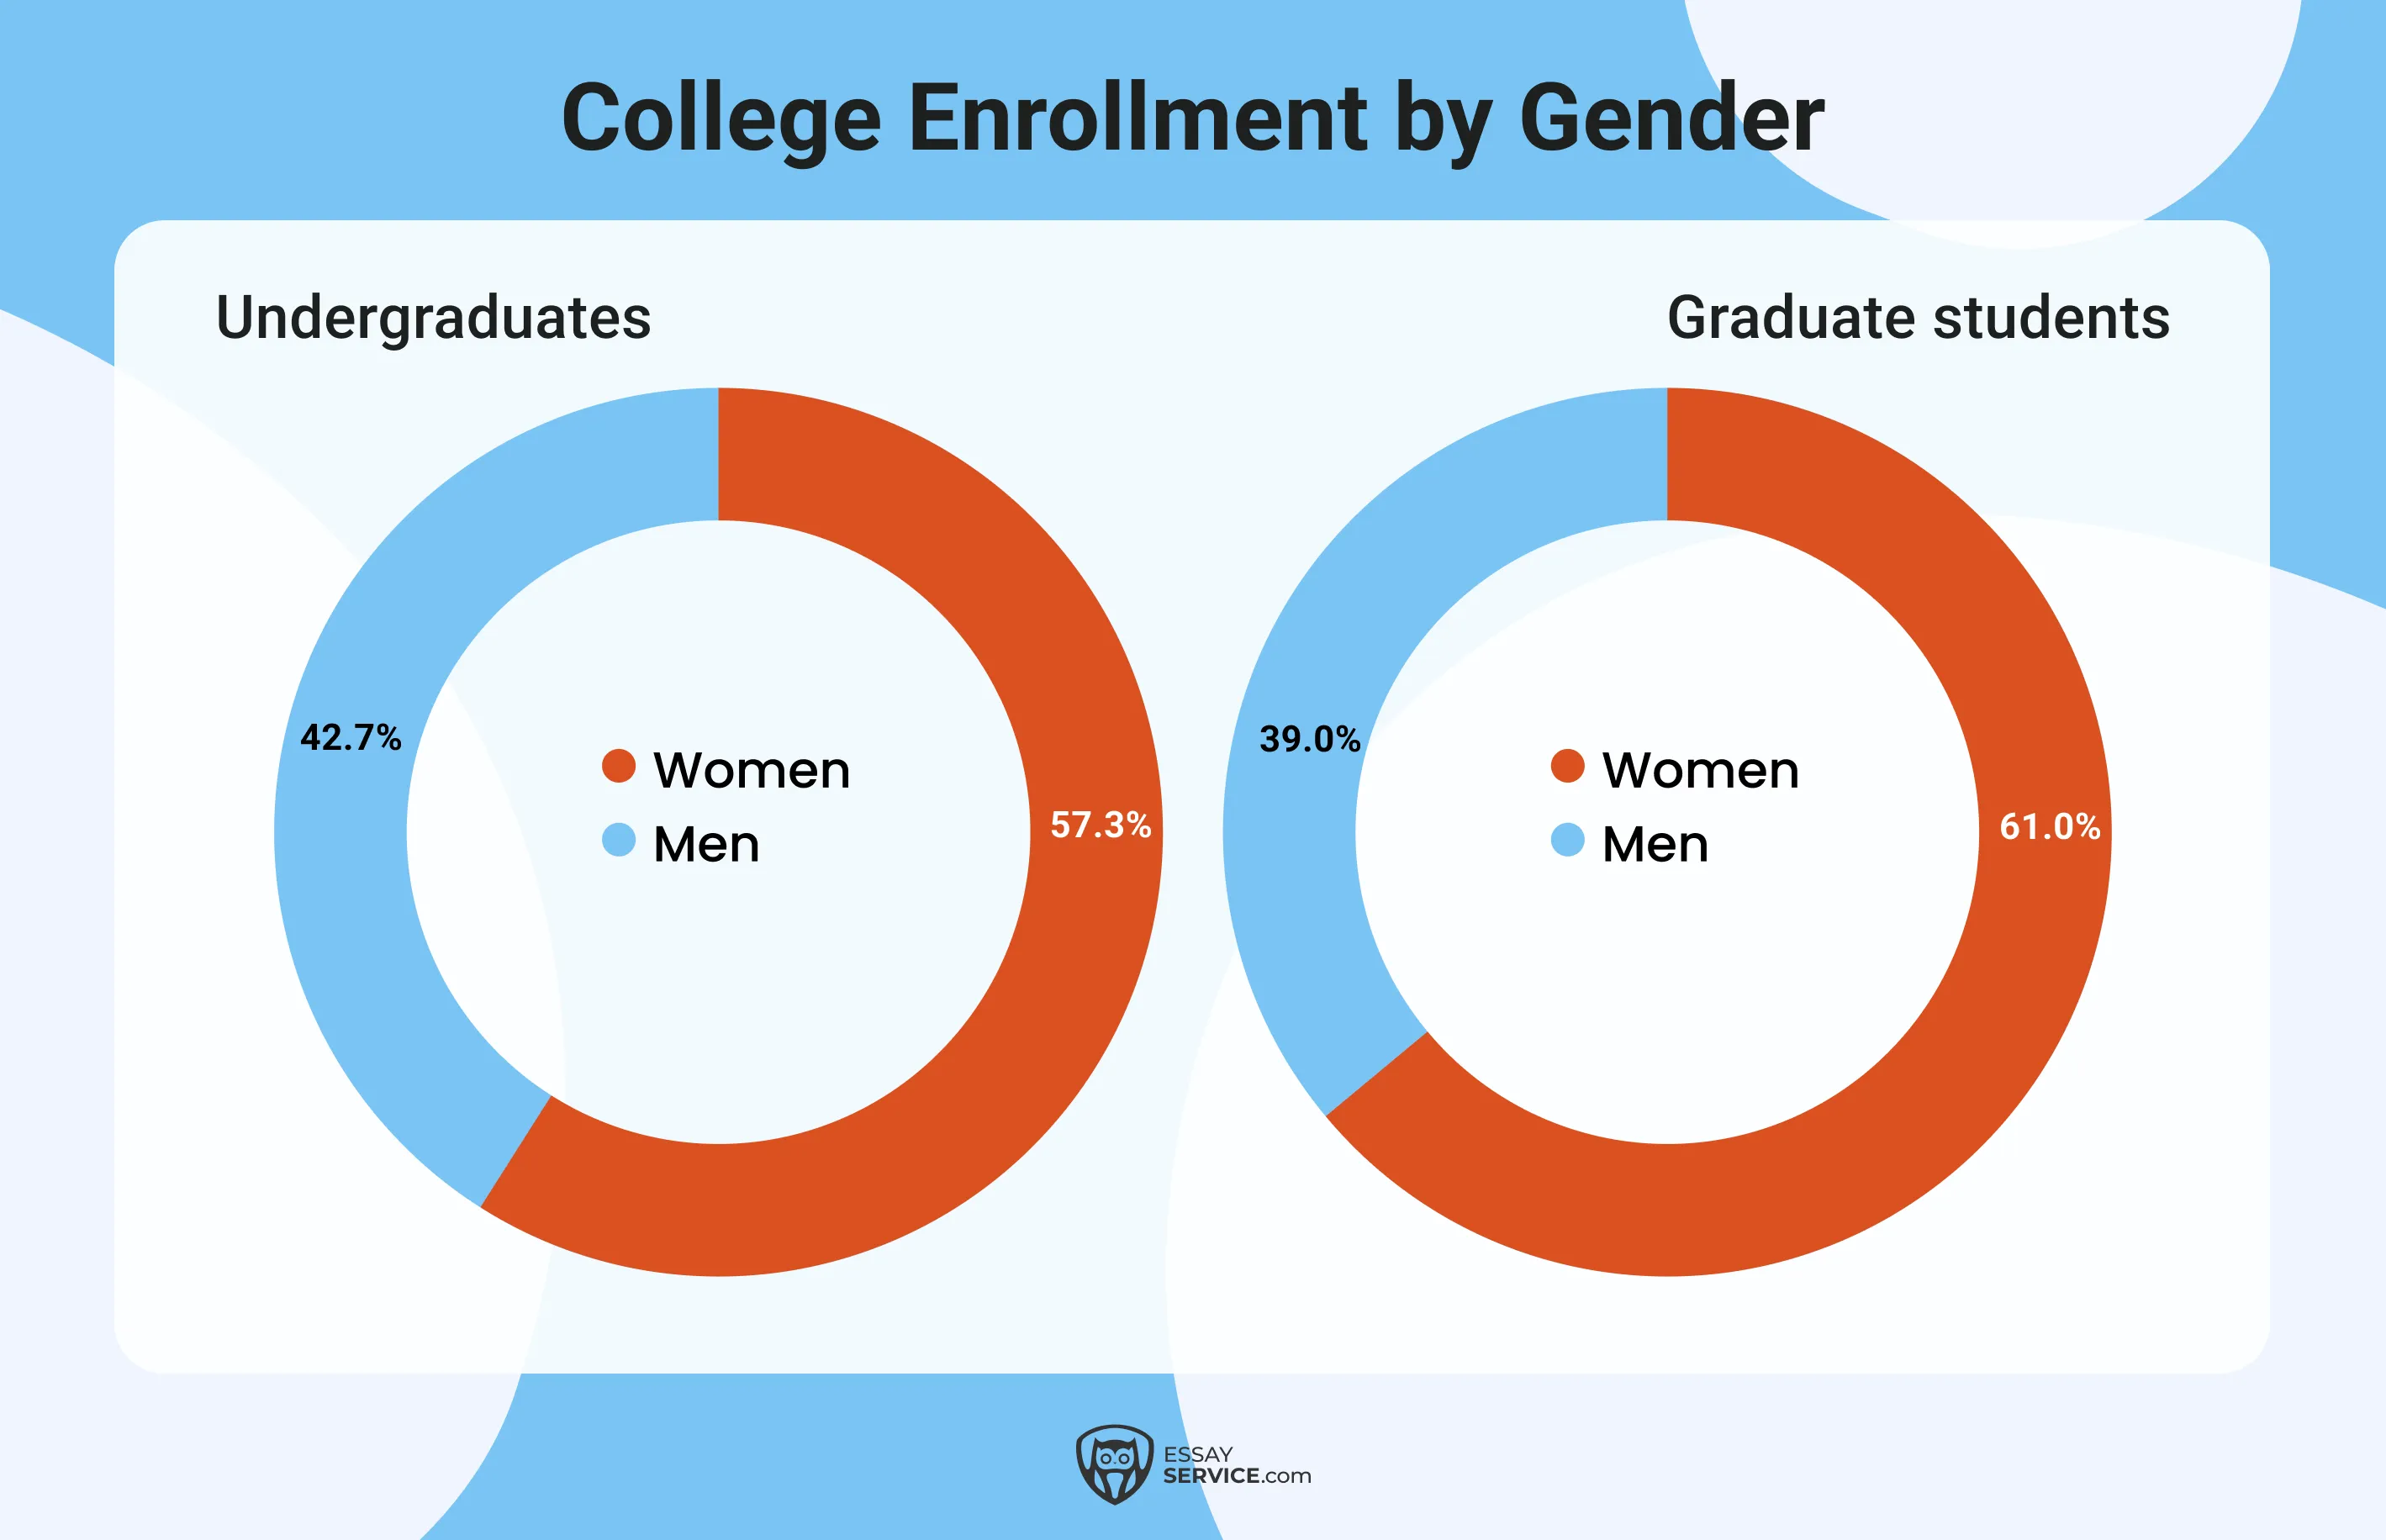
- 57.3% of undergraduates are women; 42.7% are men.
- Among graduate students, 61.0% are women and 39.0% are men.
- 43.8% of women aged 18 to 24 are enrolled in college or graduate school.
- 34.2% of men in that same age group are enrolled.
- 58.5% of bachelor’s degrees are awarded to women.
- Women also earn 62.6% of associate’s degrees and 62.8% of master’s degrees.
College Enrollment by Race and Ethnicity
Student enrollments look different across different racial and ethnic groups. Let's take a look at the trends that reflect how students from different ethnic backgrounds deal with higher education:
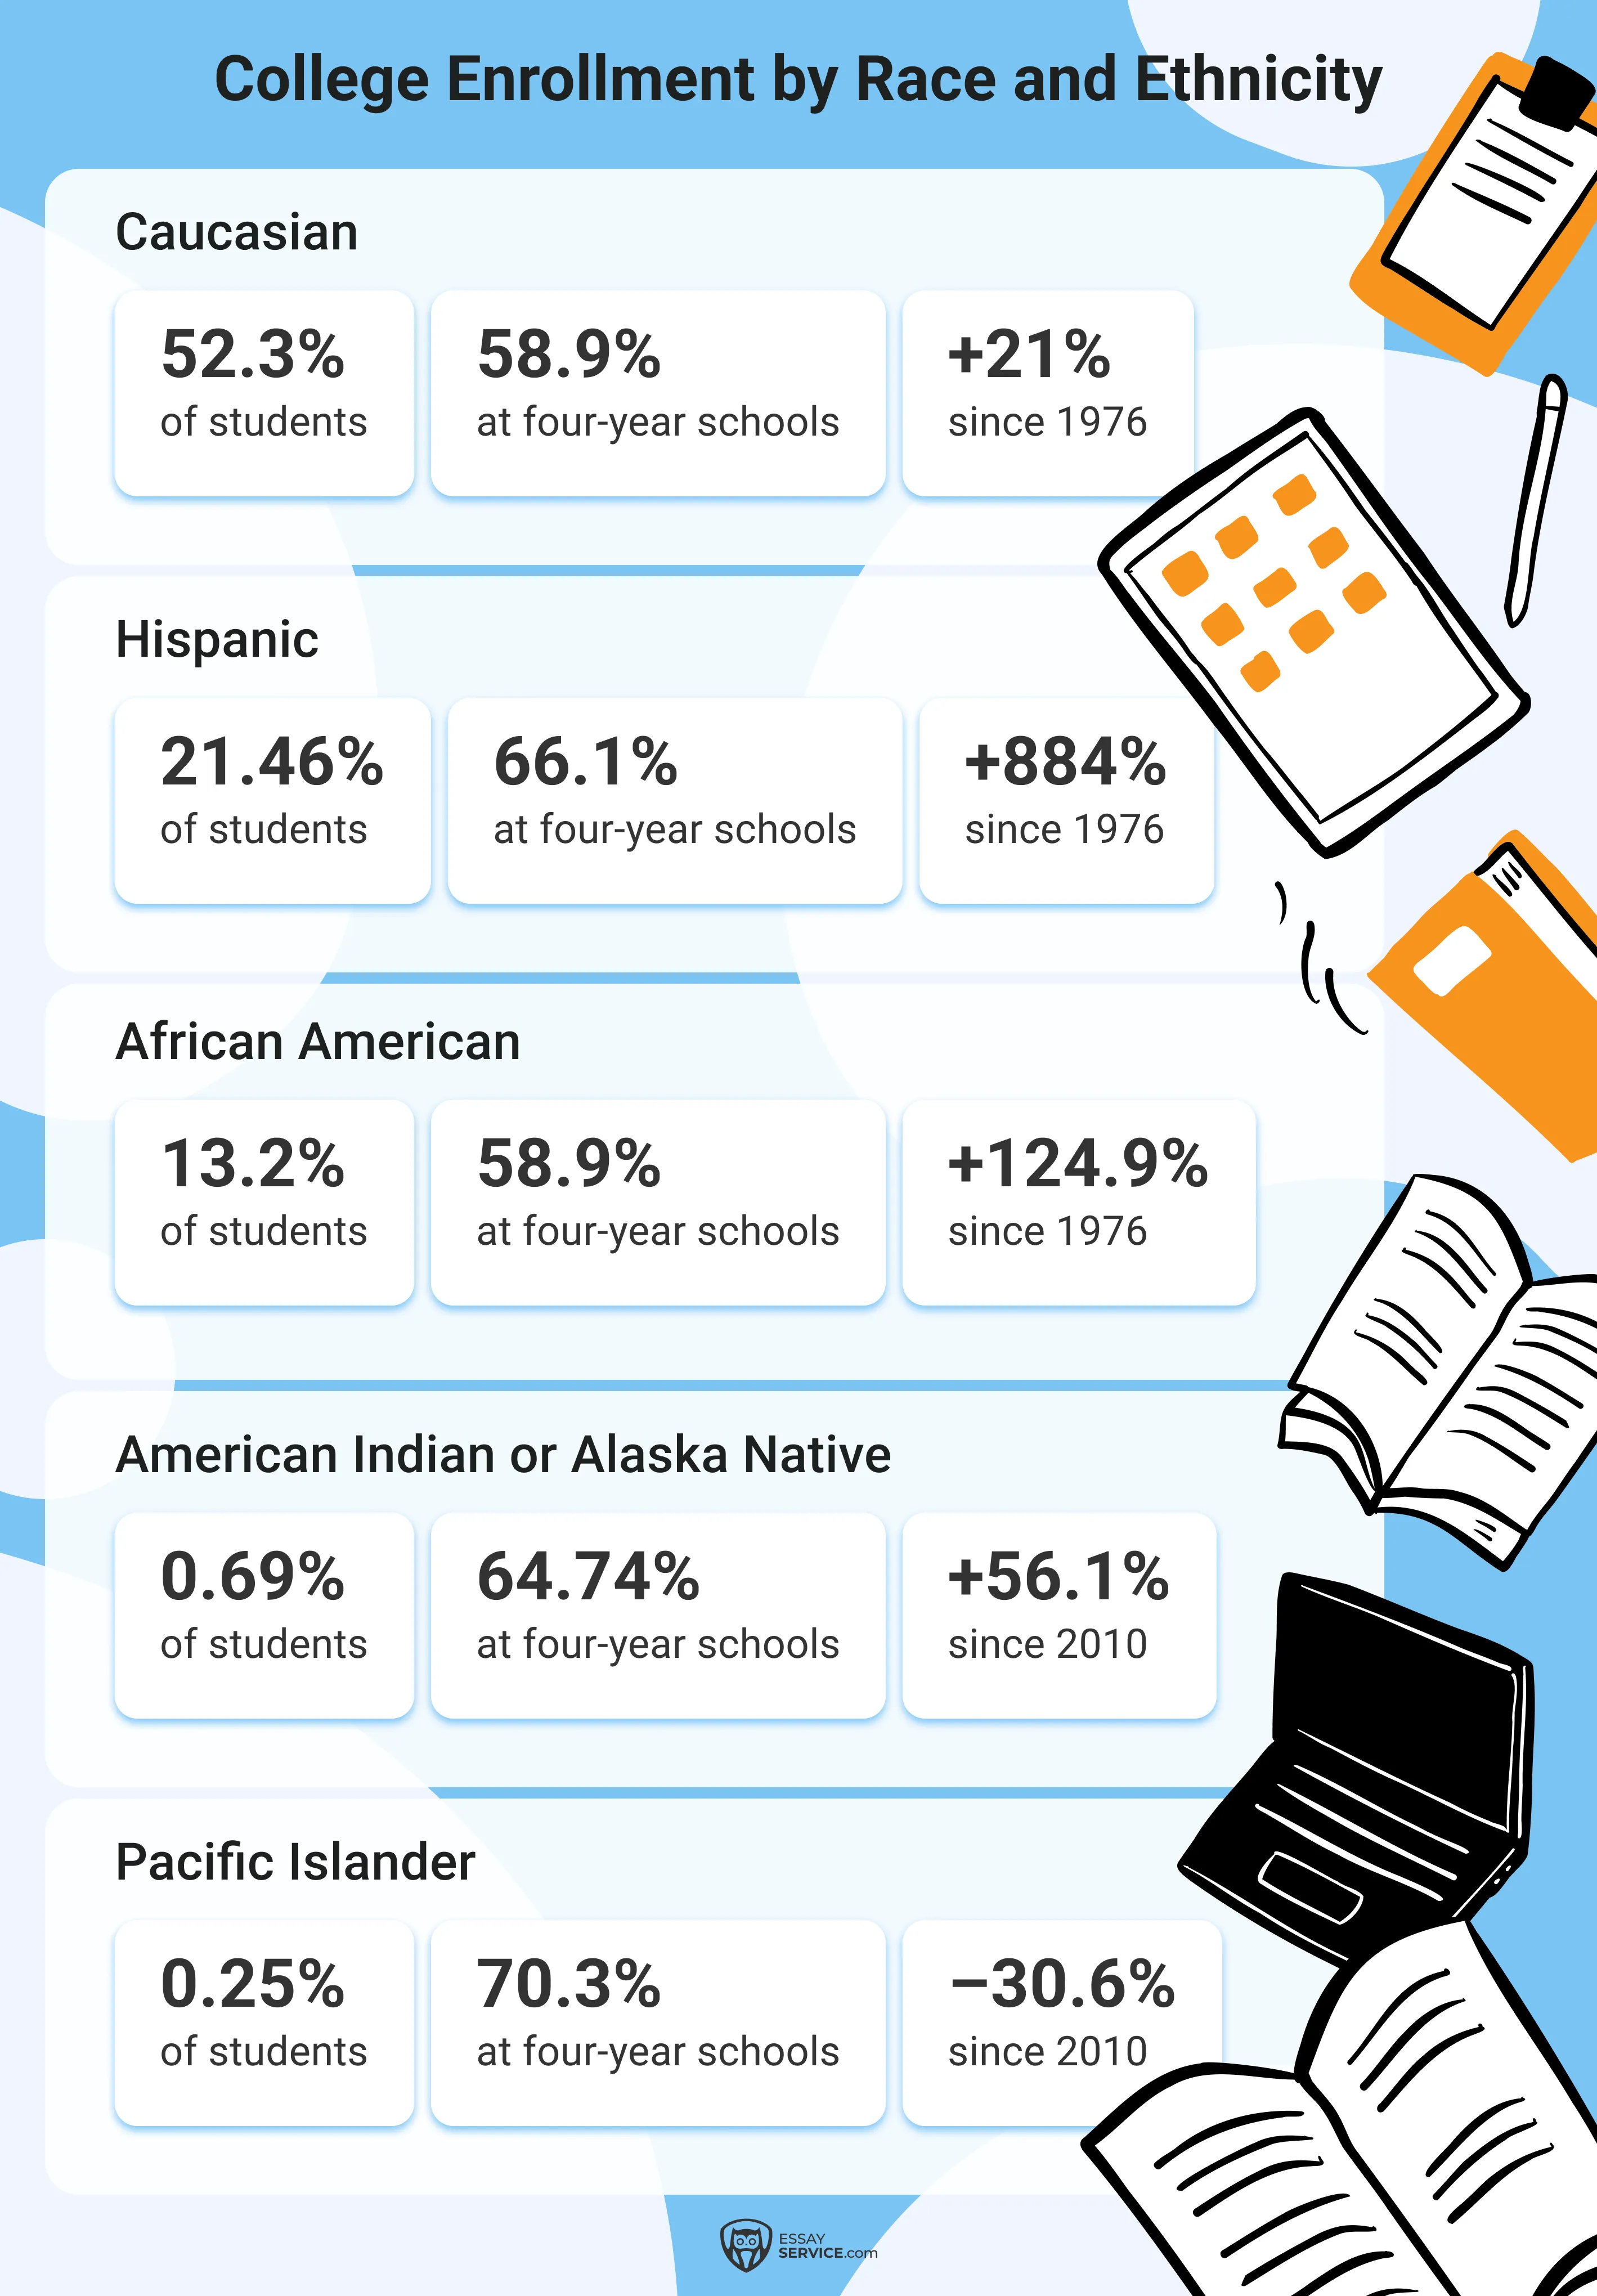
- 52.3% of college students are Caucasian, and 58.9% of them attend four-year schools.
- 21.46% of students are Hispanic, and 66.1% go to four-year colleges.
- 13.2% of students are African American. Their enrollment has grown 124.9% since 1976, and 71.88% attend four-year schools.
- 7.39% of students are Asian or Asian American. Since 2010, their enrollment has increased 12.6%, and 78.77% are in four-year programs.
- 0.69% of students are American Indian or Alaska Native. Their numbers have grown 56.1% since 1976, and 64.74% are enrolled in four-year colleges.
- 0.25% of students are Pacific Islander. Their enrollment has dropped 30.6% since 2010, and 70.3% go to four-year schools.
The numbers show clear growth for some groups, especially Hispanic and African American students. The data also points to uneven access: American Indian, Alaska Native, and Pacific Islander students still make up a very small share of the college population.
College Enrollment by Age
College isn’t just for teens fresh out of high school. The numbers show a range across different age groups, with traditional and non-traditional students learning side by side. Here’s how enrollment breaks down by age group:
- 18 to 19 years old: 26.84%
- 20 to 24 years old: 38.52%
- 25 to 29 years old: 9.19%
- 30 to 34 years old: 5.71%
- 35 to 39 years old: 3.72%
- 40 to 49 years old: 4.1%
- 50 and older: 2.18%
College Enrollment and Studying Abroad
College enrollment trends don’t stop at national borders. Each year, thousands of students take their education overseas. Here's what the numbers say:
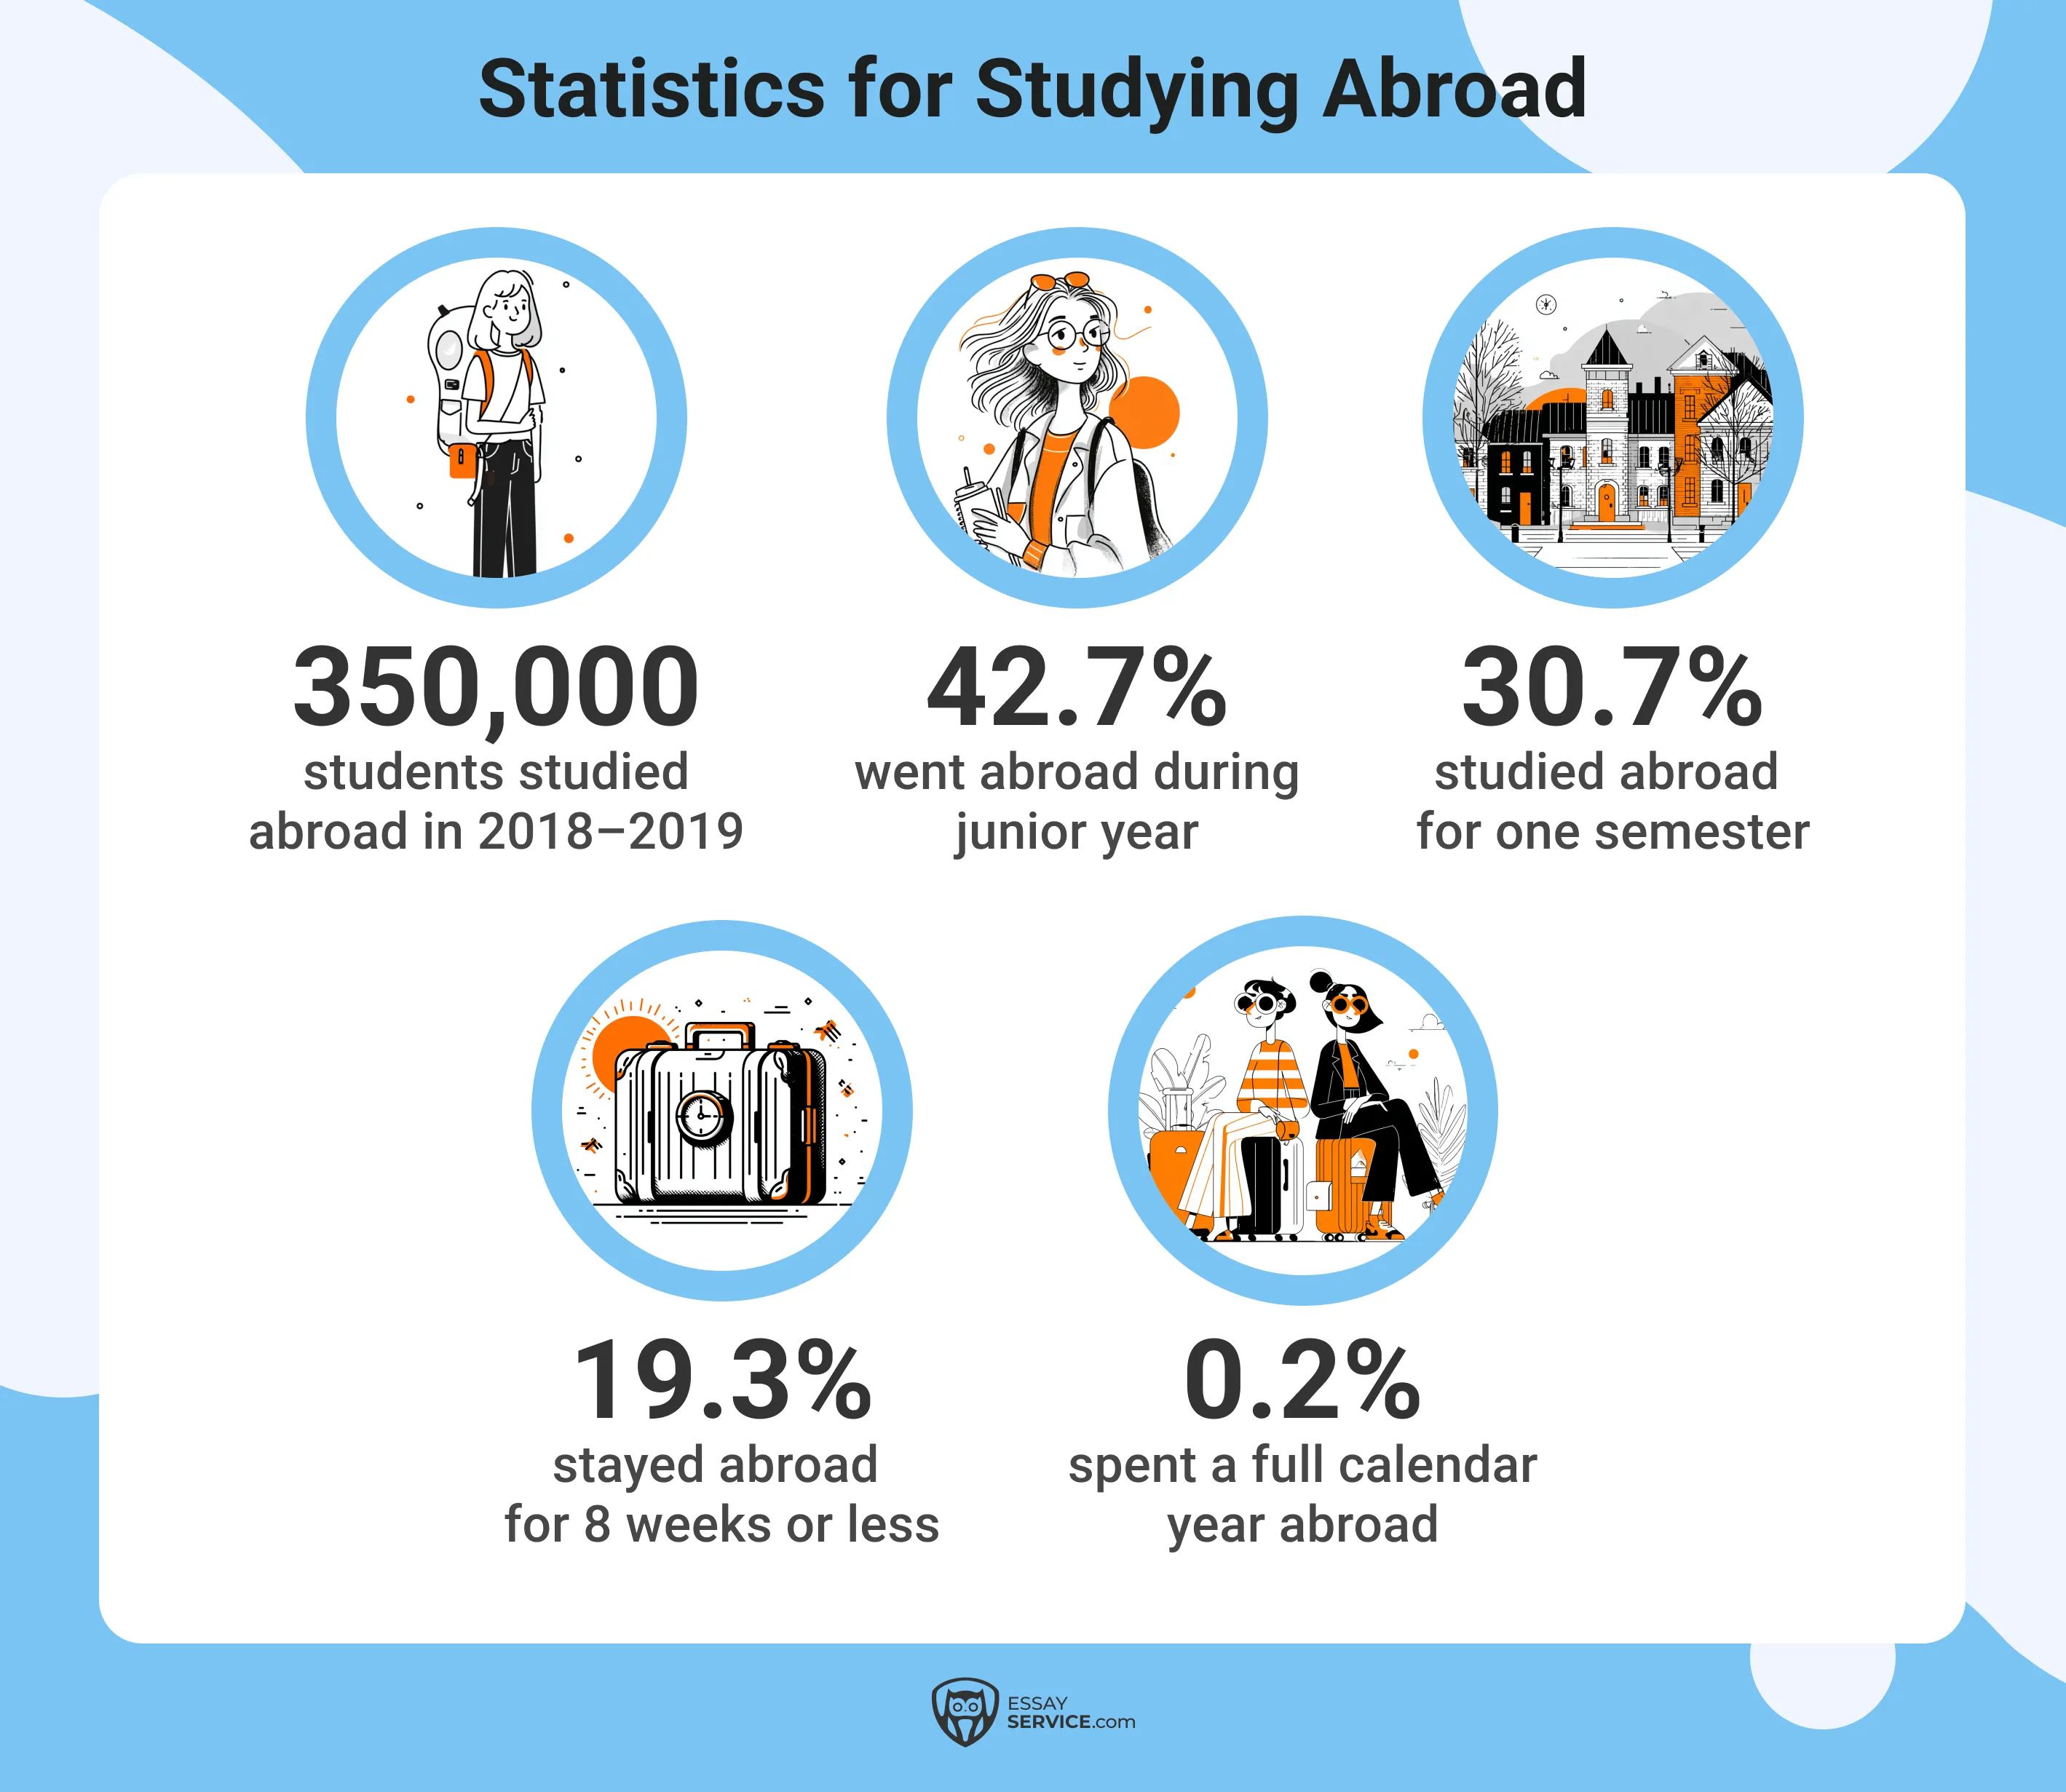
- About 350,000 students studied abroad during the 2018–2019 school year.
- 42.7% went abroad during their junior year.
- 30.7% studied abroad for one semester.
- 19.3% stayed for eight weeks or less.
- Only 0.2% spent a full calendar year abroad.
- 55.7% chose Europe as their destination.
- Study abroad participation has dropped 33.3% over the past 10 years.
- 68.7% of study abroad students identify as Caucasian.
- 10.9% identify as Hispanic.
- 8.9% identify as Asian or Pacific Islander.
College Enrollment During the COVID-19 Pandemic
The pandemic was particularly hard on college enrollment. Students who were already facing barriers to higher education were especially affected. As one study based on nearly 10 million students showed, college enrollment rates dropped among high school graduates in both 2020 and 2021. Retention rates for students who had started college just before the pandemic also fell. The ones that were already at risk of not continuing their education were the most affected.
California Community Colleges lost nearly 300,000 students between fall 2019 and 2021. The biggest declines were among African American and Hispanic students. The drop affected both career-focused programs and academic courses meant for transfer. Having more online classes before the pandemic didn’t make a difference because enrollment still fell. Course completion and grading patterns shifted, too, especially in spring 2020 when everything first shut down.
College Enrollment Trends: Future Predictions
College enrollment is expected to climb again after years of decline. Of course, the pace will vary depending on factors like age, gender, and enrollment type, but overall, the numbers are moving up.
- Total enrollment is projected to rise 8% between 2020 and 2030.
- Enrollment under age 25 is expected to grow 2% from 2019 to 2030.
- Ages 25–34 will see a 4% increase by 2030.
- Ages 35+ are projected to grow 18% between 2019 and 2030.
- Full-time student enrollment is projected to rise 7%.
- Part-time student enrollment will grow 9%.
- Undergraduate enrollment is expected to increase by 8%.
- Graduate enrollment will rise 6%.
- Public institution enrollment is projected to grow 9%.
- Private institution enrollment is expected to increase by 5%.
- First-time freshmen enrollment will rise 14% from 2020 to 2030.
What It All Means
Here are the main takeaways from the latest college enrollment data:
- Enrollment is projected to grow 8% by 2030.
- Women continue to outnumber men in both enrollment and degree completion.
- Older students are returning to college in greater numbers.
- Hispanic and African American enrollment is rising steadily.
- Study abroad participation has dropped by 33% over the past decade.
- Community colleges saw major enrollment losses during the pandemic.
- Both public and private schools are expected to see modest growth.
With the college experience constantly changing, the challenges students face remain the same: tight schedules, growing workloads, the constant pressure to stay on track... Anyone can get overwhelmed without a support system. EssayService's professional writers can give you expert writing assistance so you can keep moving forward.
Frequently Asked Questions
Is College Enrollment Increasing or Decreasing?
What Demographic Is Most Enrolled in College?
What Percent of the U.S. Population Goes to College?
.png)
Jaroslav specializes in helping students unlock their creative side and let it shine. Armed with his Bachelor’s degree in creative writing, he imparts his advice on making communication effective and engaging.
- National Center for Education Statistics. (2024, May). College Enrollment Rates. Nces.ed.gov. https://nces.ed.gov/programs/coe/indicator/cpb/college-enrollment-rate
- Projections of Education Statistics to 2028. (n.d.). Nces.ed.gov. https://nces.ed.gov/programs/PES/section-5.asp
- The Impact of Covid-19 on Community College Enrollment and Student Success: Evidence from California Administrative Data | ifo Institute. (2022). Ifo Institute. https://www.ifo.de/en/cesifo/publications/2022/working-paper/impact-covid-19-community-college-enrollment-and-student-success
.png)


New posts to your inbox
Your submission has been received!