Key Takeaways
- About 1 in 4 students does not persist into the second fall, making the sophomore slump in college a key risk point.
- 77.6 percent persist into the second fall, but only 69.5 percent stay at the same school.
- Part-time students struggle most, with just 53.2 percent continuing into year two.
- 84.4 percent of full-time students reach their second year.
- More than one in four students aged 25+ leave during the sophomore year.
- Retention is lower for Hispanic (65.4 percent), Black (58.5 percent), and Native American (56.0 percent) students.
- Average GPAs often rise, showing the slump affects persistence more than grades.
Sophomore slump is a dip in performance and engagement during the second year of college. The phenomenon is often explained as regression to the mean (those who outperformed expectations as freshmen return to the average) rather than a curse. National enrollment data show that roughly 1 in 4 students does not persist into the second fall. Some datasets suggest persistence has risen slightly in recent cohorts, and average GPAs often increase from freshman to sophomore year, though patterns vary by institution and student group. However, a significant minority of students do struggle with lower grades and are more likely to leave school.
In the context of sophomore slump statistics, consistent academic support by EssayService helps students manage pressure before small setbacks turn into longer-term struggles.

Don’t Trust AI with Grades
Our human writers help you submit work you can stand behind, even during high-stress weeks.
What Is Sophomore Slump?
The sophomore slump refers to a noticeable dip in academic motivation, engagement, or performance that some students experience during their second year of college.
The difference shows up in what students are actually dealing with. Freshman year struggles usually come from learning how college works at all - living independently, handling schedules, and figuring out expectations. By the second year, those basics are familiar. What changes is the environment. Academic activity intensifies, decisions feel heavier, and the built-in support of year one quietly drops off. That shift helps explain why sophomore slump statistics point to the second year as a pressure point, even for students who seemed settled early on.
How Common Is the Sophomore Slump?
The college sophomore slump is more common than it sounds, even among students who handled their first year well.
- Second-year attrition: About 23 percent of students never make it into year two, and another 10 percent leave before reaching junior year. That makes the sophomore year one of the most fragile stretches in college.
- Retention and persistence: Roughly 77.6 percent technically stay enrolled, but 69.5 percent remain at the same institution. This gap points to uncertainty, transfers, or quiet disengagement rather than a clean break from college.
- Dropout after freshman year: Around 22.3 percent of first-time freshmen leave after just one year, which often feeds into broader instability later on.
- GPA patterns: Grades do not collapse across the board. Average GPAs often inch upward in the second year, which suggests the slump shows up more in motivation, direction, and confidence than in raw academic ability.
For a broader context on how student persistence and dropout patterns fit into the bigger picture, see EssayService’s overview of college enrollment statistics.
Who is Most Affected by the Sophomore Slump?
Sophomore slump shows up most often among part-time students, older learners, and those balancing school with financial pressure or major life responsibilities. Students from historically underrepresented racial and ethnic groups face higher second-year attrition, as do those in demanding, tightly sequenced majors such as Computer Science.
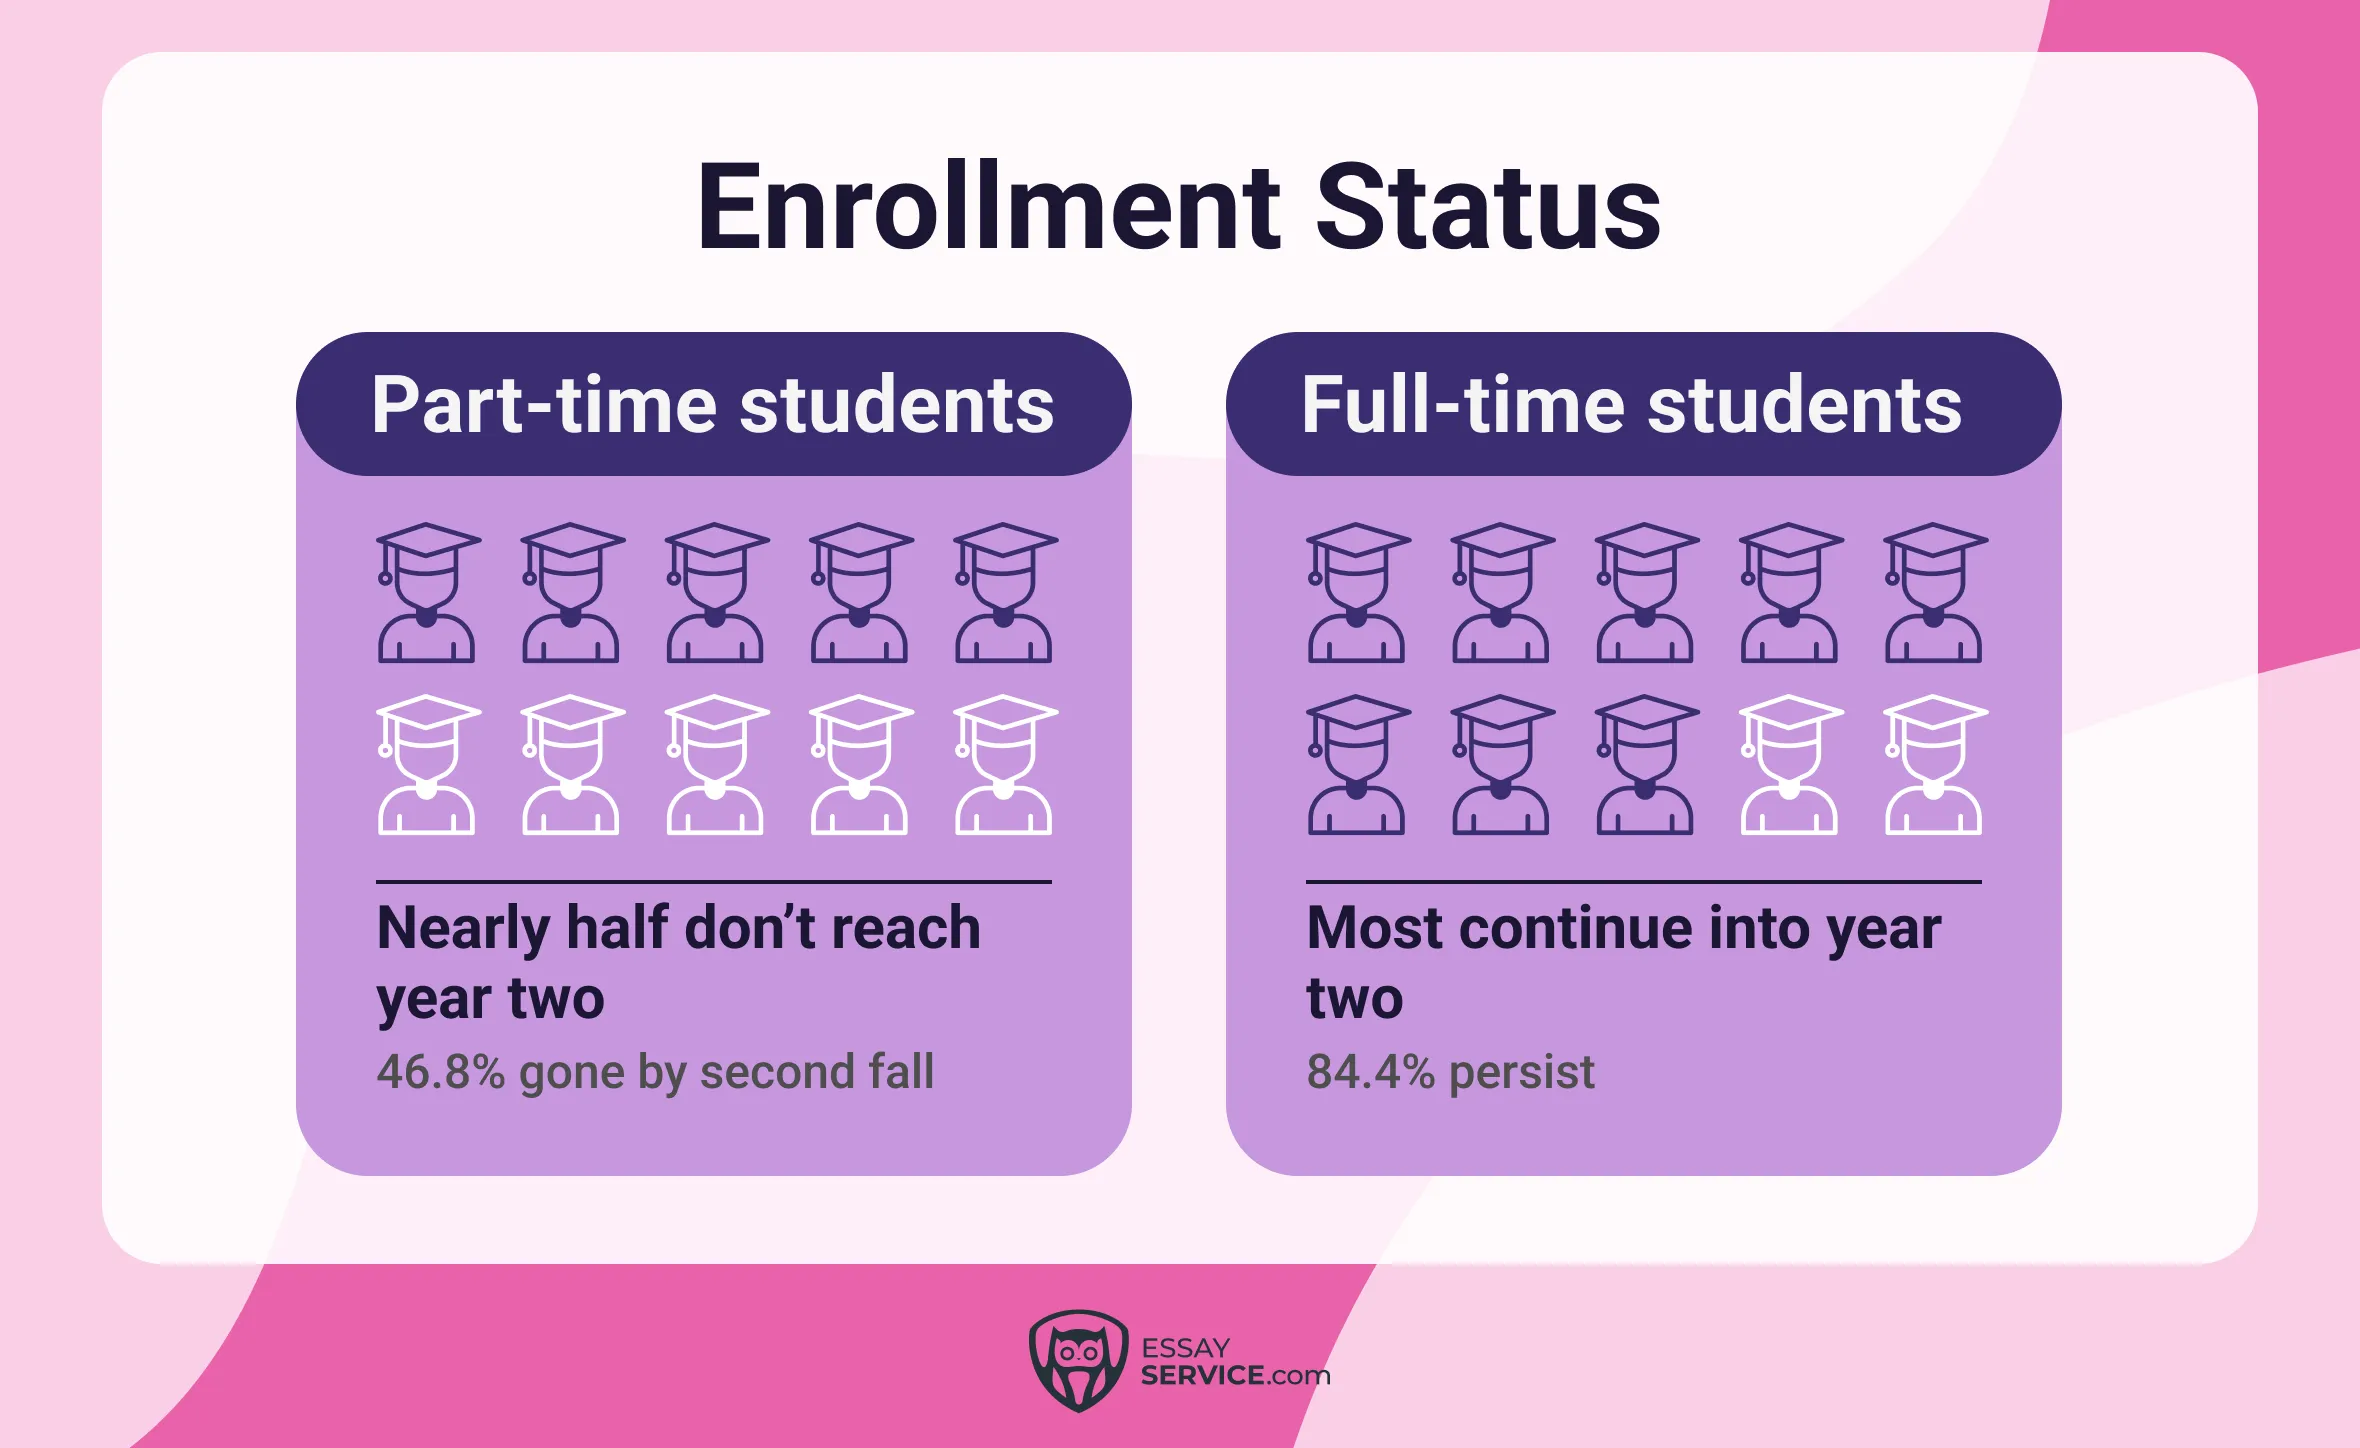
Enrollment Status
The sophomore year looks very different depending on how students are enrolled. For part-time students, the margin for error is thin. About 32.6 percent do not come back for the spring semester, and 46.8 percent do not persist before the second fall. Full-time students hold on more easily, with 84.4 percent continuing into year two. Time on campus matters here. When classes compete with jobs and social life happens off-campus, it becomes harder to stay anchored during the second year.
Age
Age shifts the sophomore slump in ways that feel very real on the ground. For full-time students who are 25 or older, more than one in four step away before the spring term or the second fall. Younger students tend to stay on track, with over 90 percent of those under 21 continuing through both semesters. For older students, the second year often hits when classes get tougher, and life outside campus does not slow down. Work, money concerns, and caregiving responsibilities start competing for attention at the same time the academic load ramps up.
.webp)
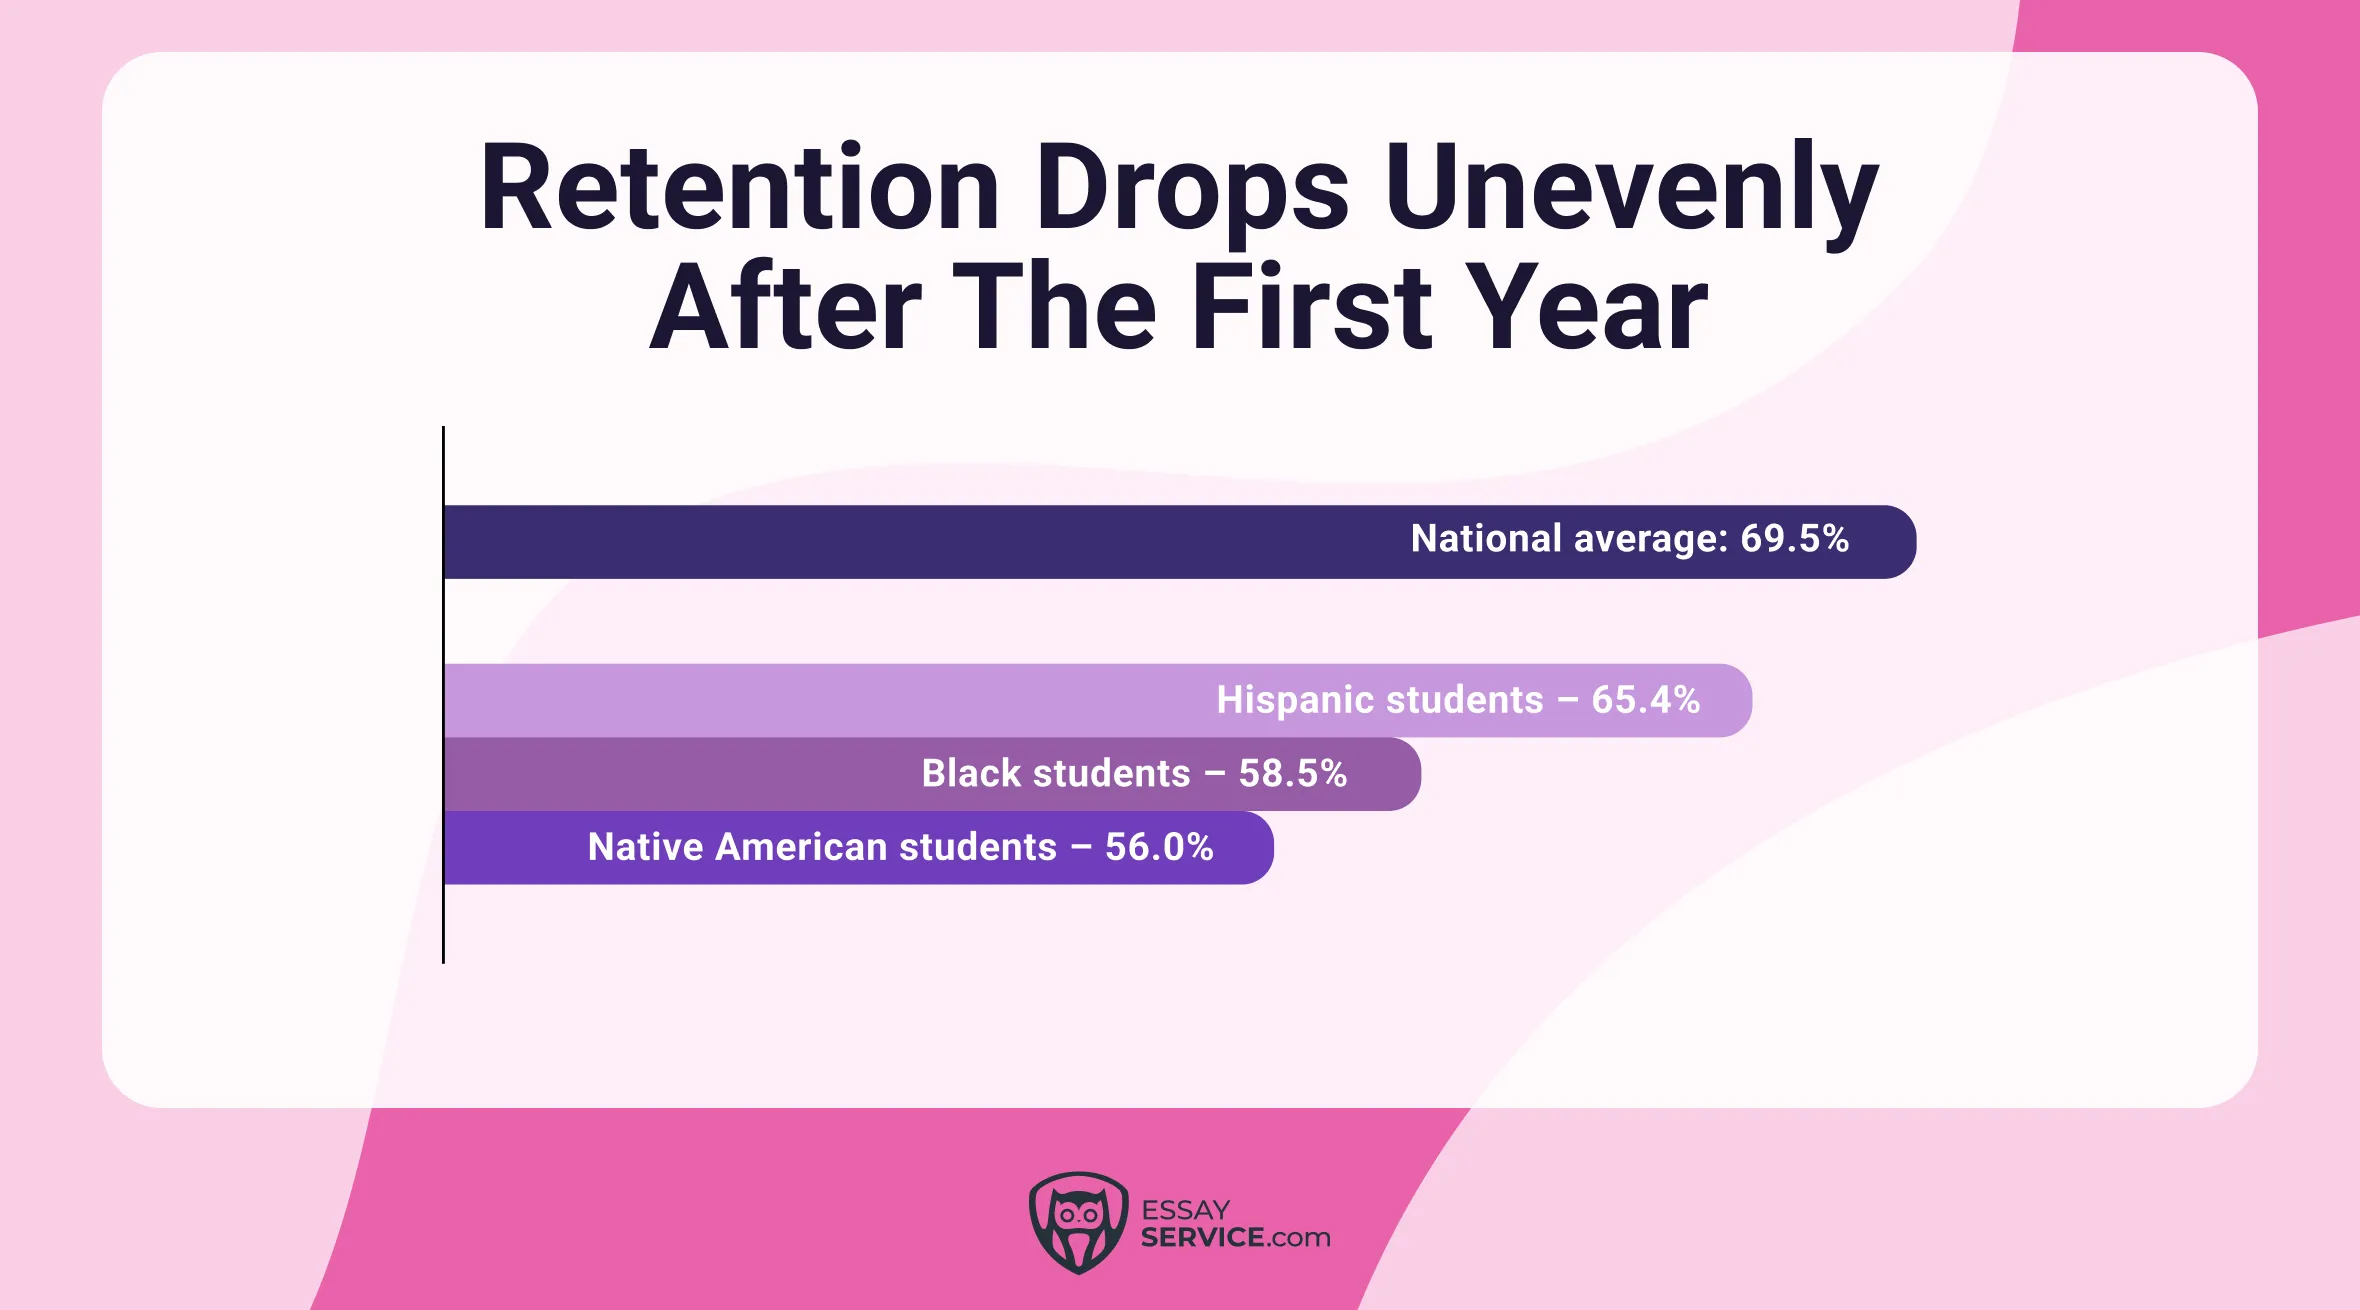
Race and Ethnicity
Retention in the sophomore year is uneven across racial and ethnic groups. The national second-fall retention rate stands at 69.5 percent, but many students fall below that level. Hispanic students retain at 65.4 percent, Black students at 58.5 percent, and Native American students at 56.0 percent. These sophomore slump statistics point to a familiar pattern: once the safety nets of the first year loosen, structural gaps have more room to shape who is able to stay enrolled and who is pushed closer to the edge.
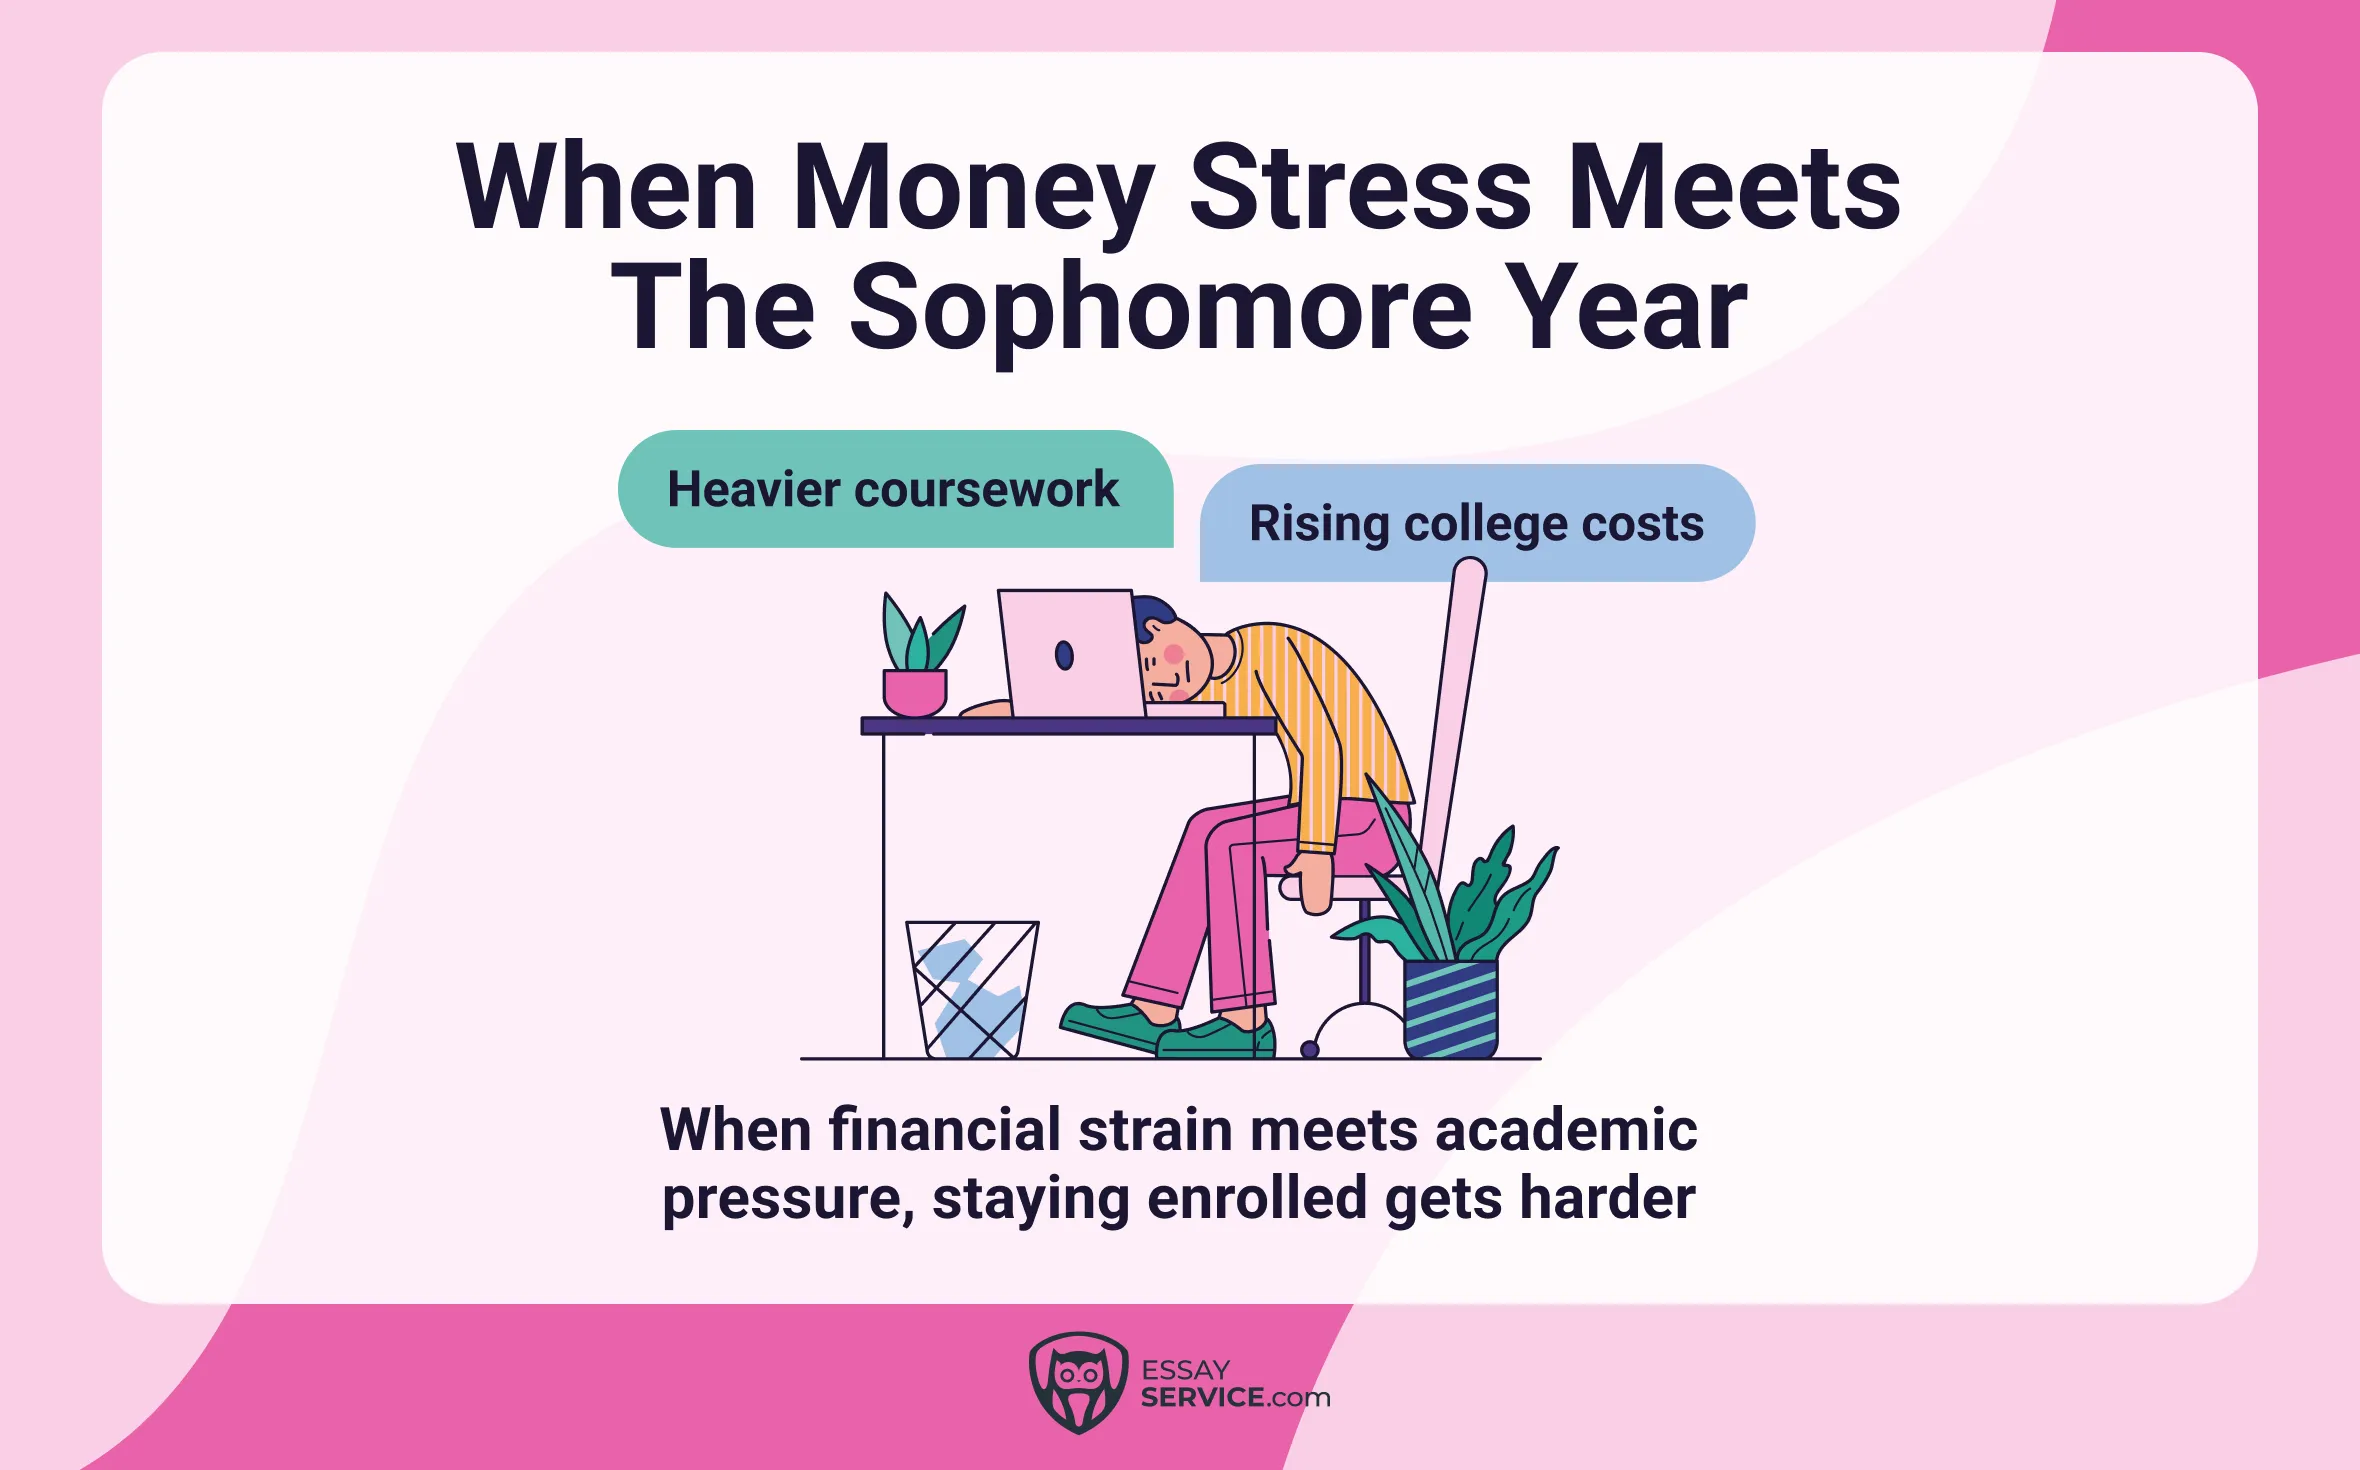
Socio-Economic Background
Money pressure quietly amplifies the sophomore slump. Students who rely on need-based aid leave at higher rates than those who do not, especially as expenses rise after the first year. When tighter finances collide with more demanding courses, staying enrolled becomes harder to sustain, even for students who were doing fine early on.
Major and Field of Study
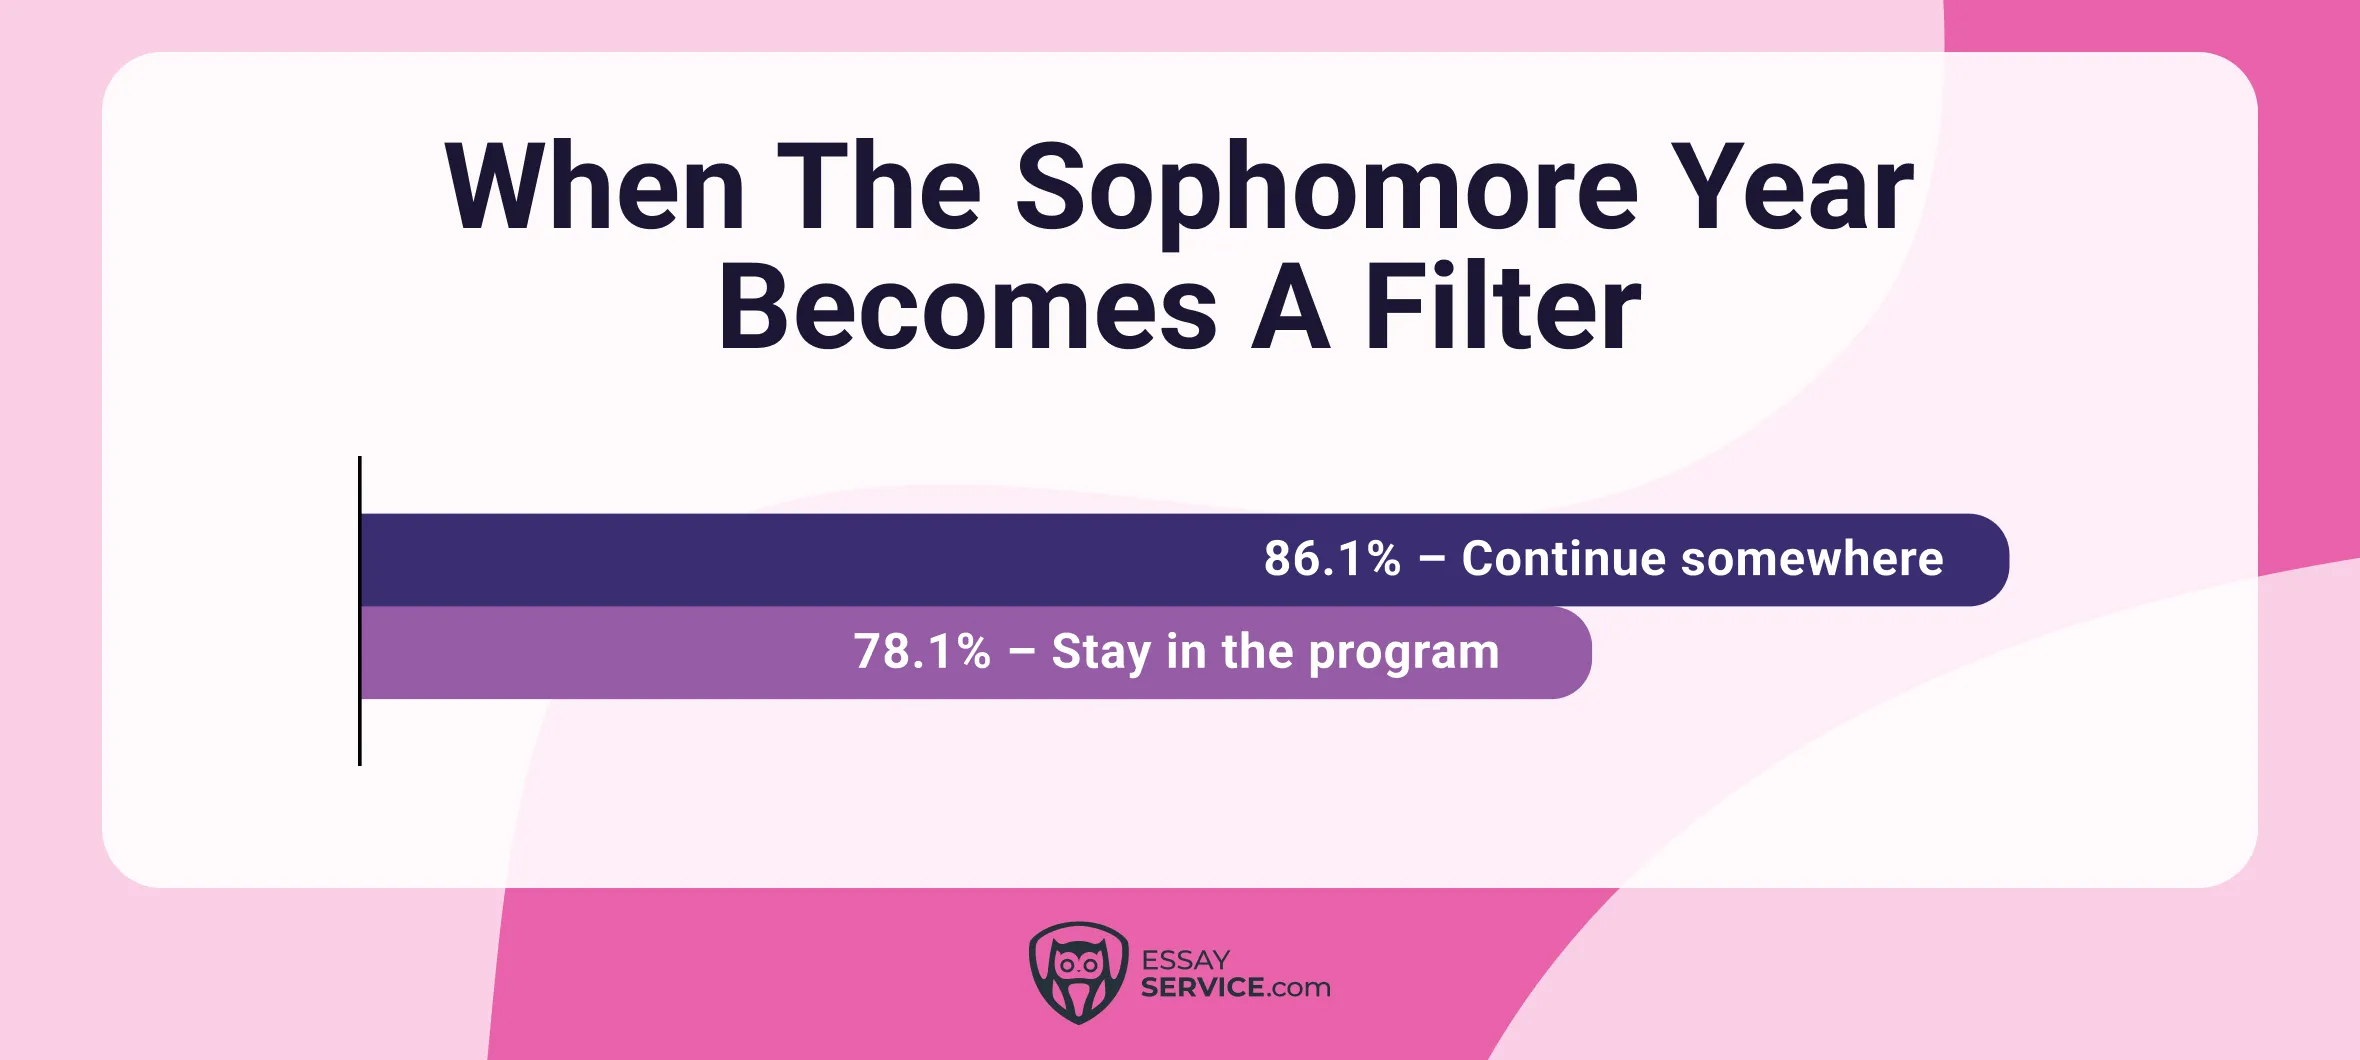
An academic field can amplify or soften the sophomore slump. While most majors see gains in persistence after the first year, Computer Science shows slight declines, with second-fall persistence at 86.1 percent and retention at 78.1 percent. Rigid sequencing and high-intensity early courses often make the second year a critical filter point in this field.
College Retention After the First Year
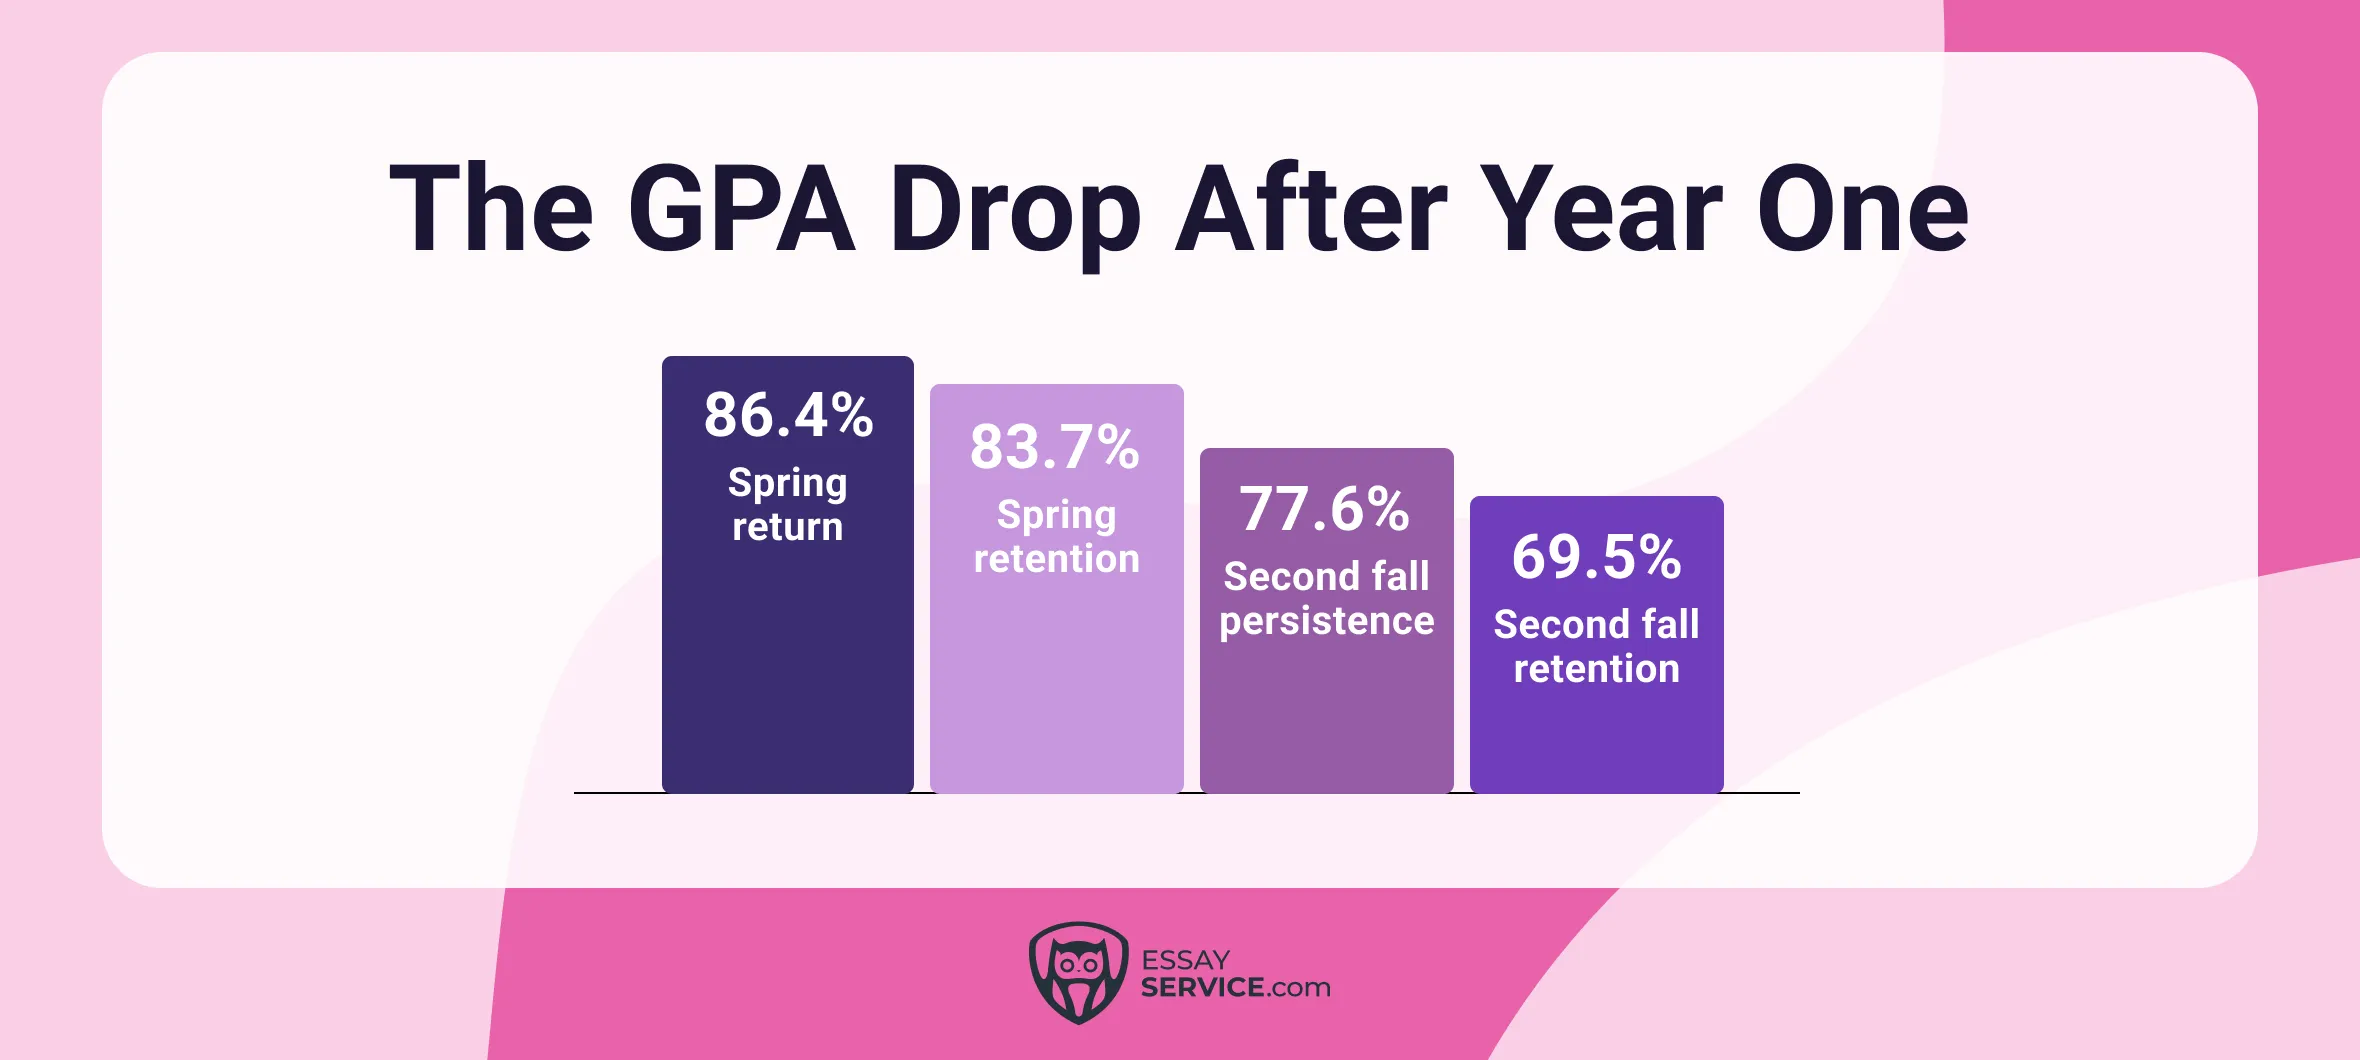
First-to-second-year retention works as a baseline because it captures the moment when early momentum is tested. In the 2023 cohort, 86.4 percent of students returned for the spring semester, and 83.7 percent stayed at their original institution at that point. By the second fall, those numbers dropped to 77.6 percent persisting somewhere and 69.5 percent remaining at the same college.
This is why retention at this stage is used to flag sophomore slump risk. By year two, students already understand how college works, so departures are less about adjustment and more about accumulated pressure. When retention falls this sharply after the first year, it often reflects waning engagement, financial strain, unclear academic direction, or support systems quietly pulling back. The numbers mark the point where the sophomore year stops being routine and starts becoming a risk zone.
How GPAs Changes Between the First and Second Year
The sophomore slump among students does not usually announce itself as a sudden collapse in grades. On paper, GPAs often edge upward between the first and second year, climbing from roughly 2.8–3.0 in freshman year to 3.0–3.2 in sophomore year. That upward shift has a logic to it. By year two, many students stop guessing their way through schedules, lean into subjects that feel workable, and study with more intention because they already know what did not work the first time around.
But averages smooth over a lot of individual stories. For some students, the second year is where things start to feel heavier academically. Classes demand more, expectations sharpen, and the built-in support of the first year fades into the background. Advisors often notice the slump here. It rarely looks like a sudden failure. Instead, grades stop improving, then slip a little at a time, often before students realize anything is off. So while many students improve, those already under pressure may feel the sophomore year hit their GPA first.
Student Engagement in the Second Year
Student engagement often fades in the second year, and not because students suddenly stop caring. Freshman year is crowded with structure, such as orientations, themed housing, and a built-in community that tells you where to go and who to meet. During sophomore year, the scaffolding disappears, expectations stay high, and the assumption is that you’ve got it handled.
.webp)
Students describe the year as louder in expectations and quieter in guidance, and that tracks with what residence-life staff tend to notice. The interesting part is that the fix is rarely a single workshop. Programs tend to work best when they give students mentorship that feels real, advising that continues past year one, and hands-on experiences that make coursework feel connected to something concrete. Without that, it’s easy to drift through the semester and realize too late that you stopped feeling part of the place.
For a deeper look at how stress affects performance, see EssayService’s breakdown of test anxiety statistics.
What Drives the Sophomore Slump
The sophomore slump usually develops through a series of small, compounding changes rather than a single moment of failure. During the second year, academic demands rise while many of the supports that structured the freshman year begin to fade. Several overlapping factors tend to drive this shift:
- Reduced institutional support as regular advising, check-ins, and structured programs taper off
- Heavier academic expectations as students move into major-specific courses with higher standards
- Greater independence pressure with more responsibility placed on time management and decision-making
- Shifts in social connection as housing changes, work increases, and peer groups spread out
Freshman Adjustment vs the Sophomore Slump
Freshman and sophomore years operate on very different assumptions, and that difference matters.
- Freshman year: Support is built in and hard to avoid. Students are funneled through orientation, placed in structured programs, assigned advisors, and given clear signals about where help lives. The system expects confusion and plans for it.
- Sophomore year: Much of that structure fades, often without announcement, and advising becomes something a second year student has to seek out. The expectation moves toward self-management, even as classes grow more demanding and academic choices start to feel permanent.
That contrast creates a quiet pressure point. First-year students are surrounded by reminders and guardrails. Second-year students are treated as settled simply because they made it through year one. Academic demands rise, majors narrow, and decisions carry more weight, yet institutional contact often drops. Many students describe this as the moment they stop being guided and start being tested. That gap is where the sophomore slump tends to take hold.
How the Sophomore Slump Shapes Graduation
Students who stay enrolled and keep moving through year two tend to carry the momentum forward. Once the second year is behind them, graduation starts to feel less like a question mark and more like a timeline.
When the sophomore year breaks, the ripple effects last. Stepping away, even briefly, stretches time-to-degree in ways that are hard to undo. Returning students often have to rebuild rhythm all over again. What looks like a short pause can turn into years of delay or a degree that never quite gets finished.
The sophomore year works like a hinge. Stay connected, and the door keeps swinging forward. Lose momentum there, and everything that follows gets heavier, slower, and harder to push open.
Real Help When Classes Get Hard
Work with experienced writers who understand academic expectations and tight timelines.
Final Words
The sophomore slump does not affect everyone, but it impacts enough students to matter. Most continue into year two, and many even improve academically, yet a large share still drifts away at this stage, especially part-time students, older learners, and those with fewer built-in supports. That makes the second year less of a routine checkpoint and more of a turning point.
When coursework piles up or direction starts to feel unclear, timely support can change the trajectory. Options like ‘pay to write my essay’ on EssayService give students a way to steady themselves before small struggles turn into reasons to step away.
Frequently Asked Questions
Why Does Sophomore Slump Happen?
How Common Is Sophomore Slump among Students?
How Many Students Leave After the First Year?
How to Deal with a Sophomore Slump?
How to Get Out of the Sophomore Slump?

Anna has been helping students become more productive learners for 20+ years now. Her experience, combined with a Master’s degree in psychology, ensures her blog posts contain only valuable insights.
- Education Data. (n.d.). College dropout rates. https://educationdata.org/college-dropout-rates
- Crown Counseling. (n.d.). GPA statistics: Average college GPA by year. https://crowncounseling.com/statistics/gpa-statistics/
- National Student Clearinghouse Research Center. (2025). 2025 persistence and retention report: First-time insights into student success after the first semester. https://www.studentclearinghouse.org/nscblog/new-report-gives-colleges-first-time-insights-into-student-success-after-the-first-semester/
- Higher Ed Today. (2023, October 2). The overlooked challenge of second-to-third-year retention. https://www.higheredtoday.org/2023/10/02/the-overlooked-challenge-of-second-to-third-year-retention/
- Daily Emerald. (n.d.). Sophomore slump and the challenges facing second-year students. https://dailyemerald.com/77714/arts-culture/sophomore-slump-and-the-challenges-facing-second-year-students/
- Humboldt State University Now. (n.d.). What’s behind the sophomore slump? https://now.humboldt.edu/news/whats-behind-the-sophomore-slump
.png)


New posts to your inbox
Your submission has been received!