.webp)
Ask how are public schools funded in the US and most people point to Washington, even though the math says otherwise. Across the 2023-24 school year, public elementary and secondary schools took in roughly $1.04 trillion, and the federal government supplied $121.2 billion of it, about 11.7%. State governments covered close to 46%, local governments about 42%.
That order, state first and federal last, sets everything that follows in this article, where we will work through US school funding system one layer at a time. We’ll look closely at where each dollar starts, the way it travels to reach the classroom, and which federal programs step in to fill the space that remains.


Leave It To Us.
Share your instructions and let our professionals handle every word from start to finish.
Revenue Sources: How Do Public Schools Get Funding?
.webp)
Public schools draw on three school funding sources. Property taxes anchor the local contribution. Sales and income taxes, once a formula sorts them, become the state contribution. Federal dollars are the last to follow, and the control of where they go is dependent on narrow programs. Here is the FY 2024 breakdown:
Local Funding (42.5% of Total)
Roughly $441 billion reached districts through local sources in 2023-24, about 42% of all revenue and a 3.6% rise over the prior year. Almost all of it starts with the property tax. Four steps turn a home's value into a school's budget.
- A county or municipality assesses what local homes, land, and businesses are worth.
- Officials attach a millage rate, which sets the tax due on each dollar of assessed value.
- Collections come in, and a fixed portion goes straight to the district.
- Local income taxes, permit fees, and small community fundraisers supply the remainder in certain places.
Two districts can set an identical rate and still collect very different amounts per student, because the one with pricier real estate has more value to tax. So funding public education at the local level rewards affluent neighborhoods almost automatically. Anyone who compares two districts should check assessed valuation per pupil first, since that figure forecasts a local budget better than most other numbers on the page.
State Funding (45.8% of Total)
The states are the largest single source. In 2023–24 they provided about $476 billion, near 46% of the total and up 3.8% year over year. Most of it comes out of statewide sales and personal income taxes, and lottery proceeds and assorted fees fill in the rest. What sets the state layer apart is redistribution, meaning how that money reaches districts. Nearly every state relies on a foundation formula, which runs a short sequence:
- The state sets a per-student target, the foundation level it counts as adequate.
- It gauges what each district can raise locally at a standard tax effort.
- State aid covers the leftover gap, so districts with thin tax bases receive the most.
New Mexico labels its version the State Equalization Guarantee. Nevada recently added roughly $1 billion more each year to its Pupil-Centered Funding Plan, which raised its per-pupil revenue sharply in a single year. This happens to reduce the local wealth gaps that property taxes produce.
Federal Funding (11.7% of Total)
Federal money is the smallest of the three sources by a wide margin, roughly $121 billion, or close to 12% of 2023–24 revenue. That share deserves context. It sits above the historical norm because pandemic aid was still moving through district budgets. COVID-19 Federal Assistance Funds alone came to $42.0 billion in FY 24, which is 34.6% of all federal revenue and 4.0% of the total, and federal revenue had already fallen 7.5% as that money ran out. Set the relief aside and federal funding for public schools looks much as it did before 2020, near 8% of the total, and local sources covered about 45%. The current 12% should recede toward that older level.
The federal role runs on a different principle. Districts almost never receive open-ended money from Washington. Federal funding for education is routed into specific programs, and a district has to satisfy the rules attached to a program before any payment clears. A short list accounts for most of the total:
How Money Is Distributed: State Funding Formulas Explained
Revenue is the easy part to raise, and the harder problem is getting it to the right districts in the right amounts, a problem that lives inside each state's funding formula. Public school funding at the state level rests on one premise: name a per-student target, size up local capacity, and supply state dollars for the shortfall. The details differ sharply by state.
Foundation Formula
.webp)
The foundation formula does most of the work in government funding for education, and it appears in some form across the majority of states. The idea behind it is simple: the state guarantees every district enough money to reach a set per-pupil level, and it covers whatever the district cannot raise on its own. That set level is the foundation, the dollar figure a state treats as the floor for a basic education.
Three steps turn that floor into an actual payment:
- Set the target. Multiply the foundation amount by enrollment, with weighting for grade level or program in many places, to get the district's full entitlement.
- Measure what's local. Apply a standard tax rate to the district's property wealth to see how much it can raise itself.
- Cover the difference. The state pays the gap between the entitlement and that local amount.
If the foundation is $10,000 per pupil and a district can raise $6,000 on its own, the state sends the remaining $4,000. Change the district and only the split changes. A property-poor district raises little and draws a heavy state payment. A wealthy one may hit the target on local revenue alone and collect almost nothing from the state. The floor holds steady while the state's share flexes around it.
Weighted Student Formula
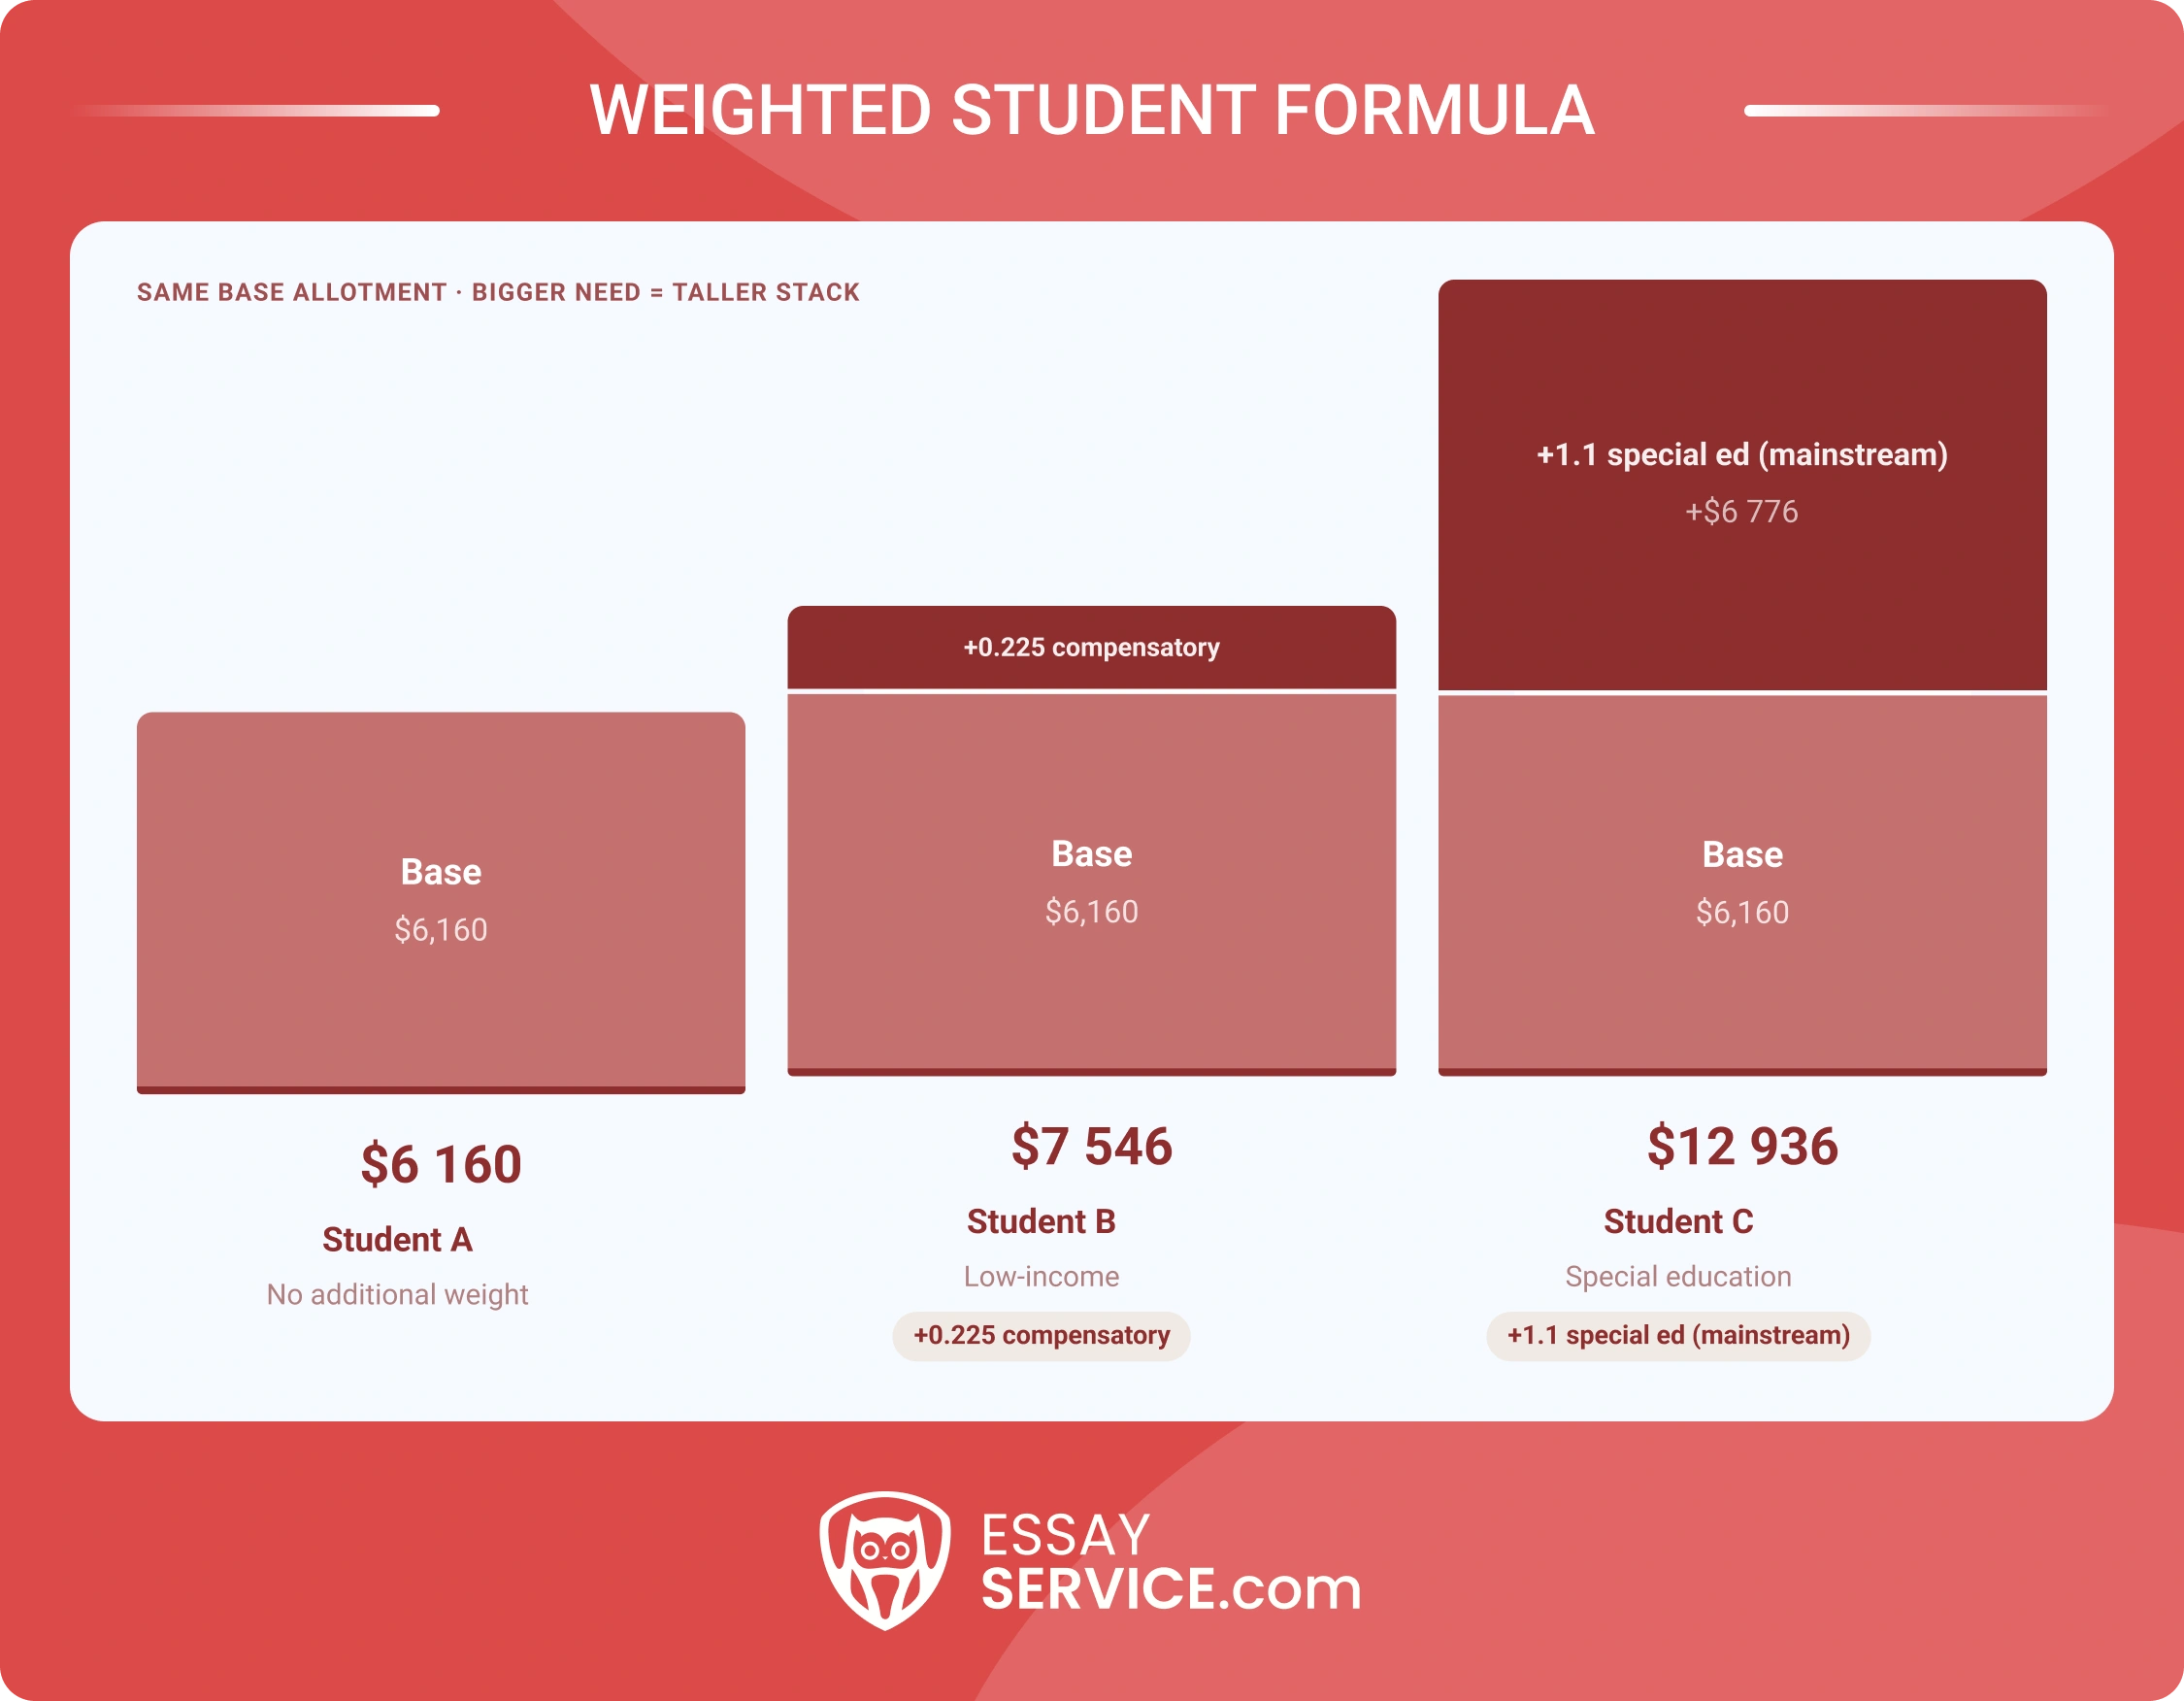
A single per-pupil figure treats every child as equally expensive to teach. That assumption rarely holds. An English learner, a child with a disability, and a child from a low-income home each cost more than the base rate assumes. Weighted student formulas handle this by tying additional funding for public schools to the traits that raise a student's cost.
The method is plain. The base weight for any child is 1.0, and extra weights layer on according to need:
Real formulas track that logic, though the size of each add-on varies widely. Texas builds on a $6,160 basic allotment and layers weights on top: an extra 0.225 to 0.275 for each low-income student, and 0.15 above the base for mainstream special education. Maryland runs heavier on the high-need end. Starting from an $8,310 per-pupil foundation, its special education funding reaches 146% of that base once the formula is fully phased in, roughly $18,053 per student.
Why Are Public Schools Inequitably Funded?
Two public schools are just a short drive apart, and yet, one stocks current lab equipment with a full staff of counselors at campus, and the second doesn’t even have enough money to fix a leaking room. This spread comes straight from the architecture of funding for public schools in most of the country. Want to know what produces this? Here’s the answer:
- Local reliance. A district tied to property taxes absorbs the wealth gaps of the blocks around it.
- Partial state repair. Equalization shaves the gap without removing it.
- Uneven internal split. One district can still fund its own schools at different levels.
The Property Tax Trap & District Boundaries
Property taxes and school funding are locked together by law, and that lock is where the inequity begins. A district taxes only the property inside its own boundaries, so the boundary itself caps what local schools can raise. The Government Accountability Office found that close to 70% of students attend the neighborhood school nearest them. The line drawn around a district quietly assigns both the school and the money behind it.
Those lines are not neutral. Many trace back to redlining and decades of lending discrimination, and the GAO reports that formerly redlined areas still split along the same racial and economic contours today. It compounds, too. When wealthier communities break away to form their own districts, the GAO found the new districts' student poverty rate ran roughly half that of the districts they left behind. Rich base, low rate, full budget. Poor base, higher rate, still short.
The Limits of State Equalization
Formulas promise a level field and deliver a partial one. They shrink disparities, then stop well short of erasing them. The clearest recent measure comes from the Education Law Center, which sorts states by how state and local dollars reach high-poverty districts against low-poverty ones. In 2023, only 17 states funded high-poverty districts progressively, down from a peak of 28 in 2022.
The spread at the extremes is stark: Utah sent 60% more per pupil to its high-poverty districts, while Connecticut sent 19% less. And the gap between states barely moved for a decade, holding between $13,000 and $14,000 per pupil across 2012 to 2022.
A few forces keep the shortfall alive:
- Revenue limits. A state can only spread money it already holds, and recessions drain the supply.
- Political friction. Districts with wealth, and the officials who speak for them, resist formulas that steer dollars elsewhere.
- Off-formula local add-ons. Many states permit local spending above the foundation, so affluent districts surge ahead again once the formula has done its part.
How Money Is Allocated Within a District?
Equity between districts is only part of the picture. A district can collect its entire state and local allotment and still divide it unevenly among its own schools. Teacher pay drives most of that split because senior teachers require higher salaries, and they gravitate toward a district's lower-poverty schools, where conditions tend to be calmer and staff stay longer. The higher-poverty schools fill up with newer teachers on lower pay. What results is a hidden per-student spending difference, even where the staffing headcounts match exactly.
Federal rules address this only halfway. The Title I comparability provision requires districts to prove that state and local spending is comparable across schools before Title I dollars land. The rule has long accepted staff counts as proof, and a headcount can mask sizable salary gaps. Government school funding can therefore look even on paper and stay lopsided in dollars. A district that means to fix this should audit actual salary outlays school by school.
Where Does the Money Actually Go? (School Expenditures)
The revenue side is only half the ledger. Where the dollars land is the other half. In FY 2024, public schools ran through $869.6 billion in current expenditures, which comes to $17,644 per pupil. Most of that total pays for people. Salaries and benefits together took 76.8% of current spending, so staff compensation makes up the bulk of any school budget. The current dollars split by function this way:
Support services hold several distinct costs: building operations and maintenance ($83.2B), counseling and health ($59.9B), transportation ($35.9B), and school and general administration. Two large expenses sit outside current spending. Districts poured about $109 billion into capital outlay, most of it new construction, and paid roughly $24 billion in interest on debt.
Done By Tomorrow.
Professionals will take your assignment and deliver a finished, original essay before your deadline hits.
Current Debates and Policies on Education Funding
Money for public schools is fought over on three fronts right now.
Pandemic aid is gone. The federal relief that lifted revenue to $121 billion has been spent. Districts that used that temporary money to pay for permanent staff are now cutting positions and programs to cover the hole it left.
The federal budget is under pressure. The administration's FY 2026 request asked to shrink the Department of Education by roughly 15% and merge 18 K-12 grant programs into one smaller block grant. House appropriators backed a 26% cut to Title I. The Senate threw out most of those cuts.
School choice went federal. The One Big Beautiful Bill Act (H.R. 1), signed July 4, 2025, created a tax credit worth up to $1,700 for donations to private-school scholarship funds. It starts in 2027 for states that opt in. Supporters see opportunity; opponents see money pulled from public schools.
And the oldest argument of how much funding is actually enough still has no answer.
If you’re trying to make sense of all these numbers and data for a school paper, remember, you can always reach out to EssayService and pay for essay while you take a little break.
Final Thoughts
Public school funding in the US rests mostly on state and local government, roughly 46% and 42% of revenue, with about 12% from Washington. Property taxes drive the local share and open gaps that state formulas only partly close. Federal money stays small, targeted, and lately contested.
Frequently Asked Questions
How Are Public Schools Funded in the US?
Are Schools Funded by Property Taxes?
Are Schools Federal Property?

Jennifer is a student currently pursuing a Journalism major. She oversees the EssayService blog team and uses her journalism skills to ensure all blog posts are accurate, trustworthy, and engaging.



New posts to your inbox
Your submission has been received!