Have you ever noticed how your bank sometimes flags a card charge that “looks” wrong, or when a delivery service adjusts the estimated arrival time because the driver is near a busy intersection? Statistics is what drives these decisions, even though we might not always call it that.
A project in statistics requires both an interesting topic and data that can be processed and analyzed. Statistics project ideas, in turn, have to be measurable, supportable with sources. And let’s not forget the final analysis, which will go nowhere without a point.
Here, you’ll find statistics project ideas for students across health, business, sports, environment, technology, public policy, consumer behavior, and several other usable areas, along with practical advice for choosing one.
What Is a Statistics Project?
A statistics project is an assignment that uses data collection, organization, analysis, and presentation to answer a specific question or examine a pattern that can be measured. In most cases, the work begins with a focused problem, then moves into numbers that help explain what is actually happening. A statistics project may compare restaurant prices across neighborhoods, examine how weather affects ride-share demand, track housing costs by city, or analyze which product features appear most often in customer reviews.
The stronger statistics project topics usually have a clear question, measurable variables, reliable data, and a method that fits the task. For example, “Do weekend delivery times differ by neighborhood?” gives the analysis a real job. “Delivery services” is just a subject area.
How to Choose the Best Statistics Project Idea
This section explains how to choose statistics project ideas by checking the question, data source, variables, scope, and method, so the topic stays practical and analysis-ready. Here are a few steps you must follow if you want to land on the right topic:
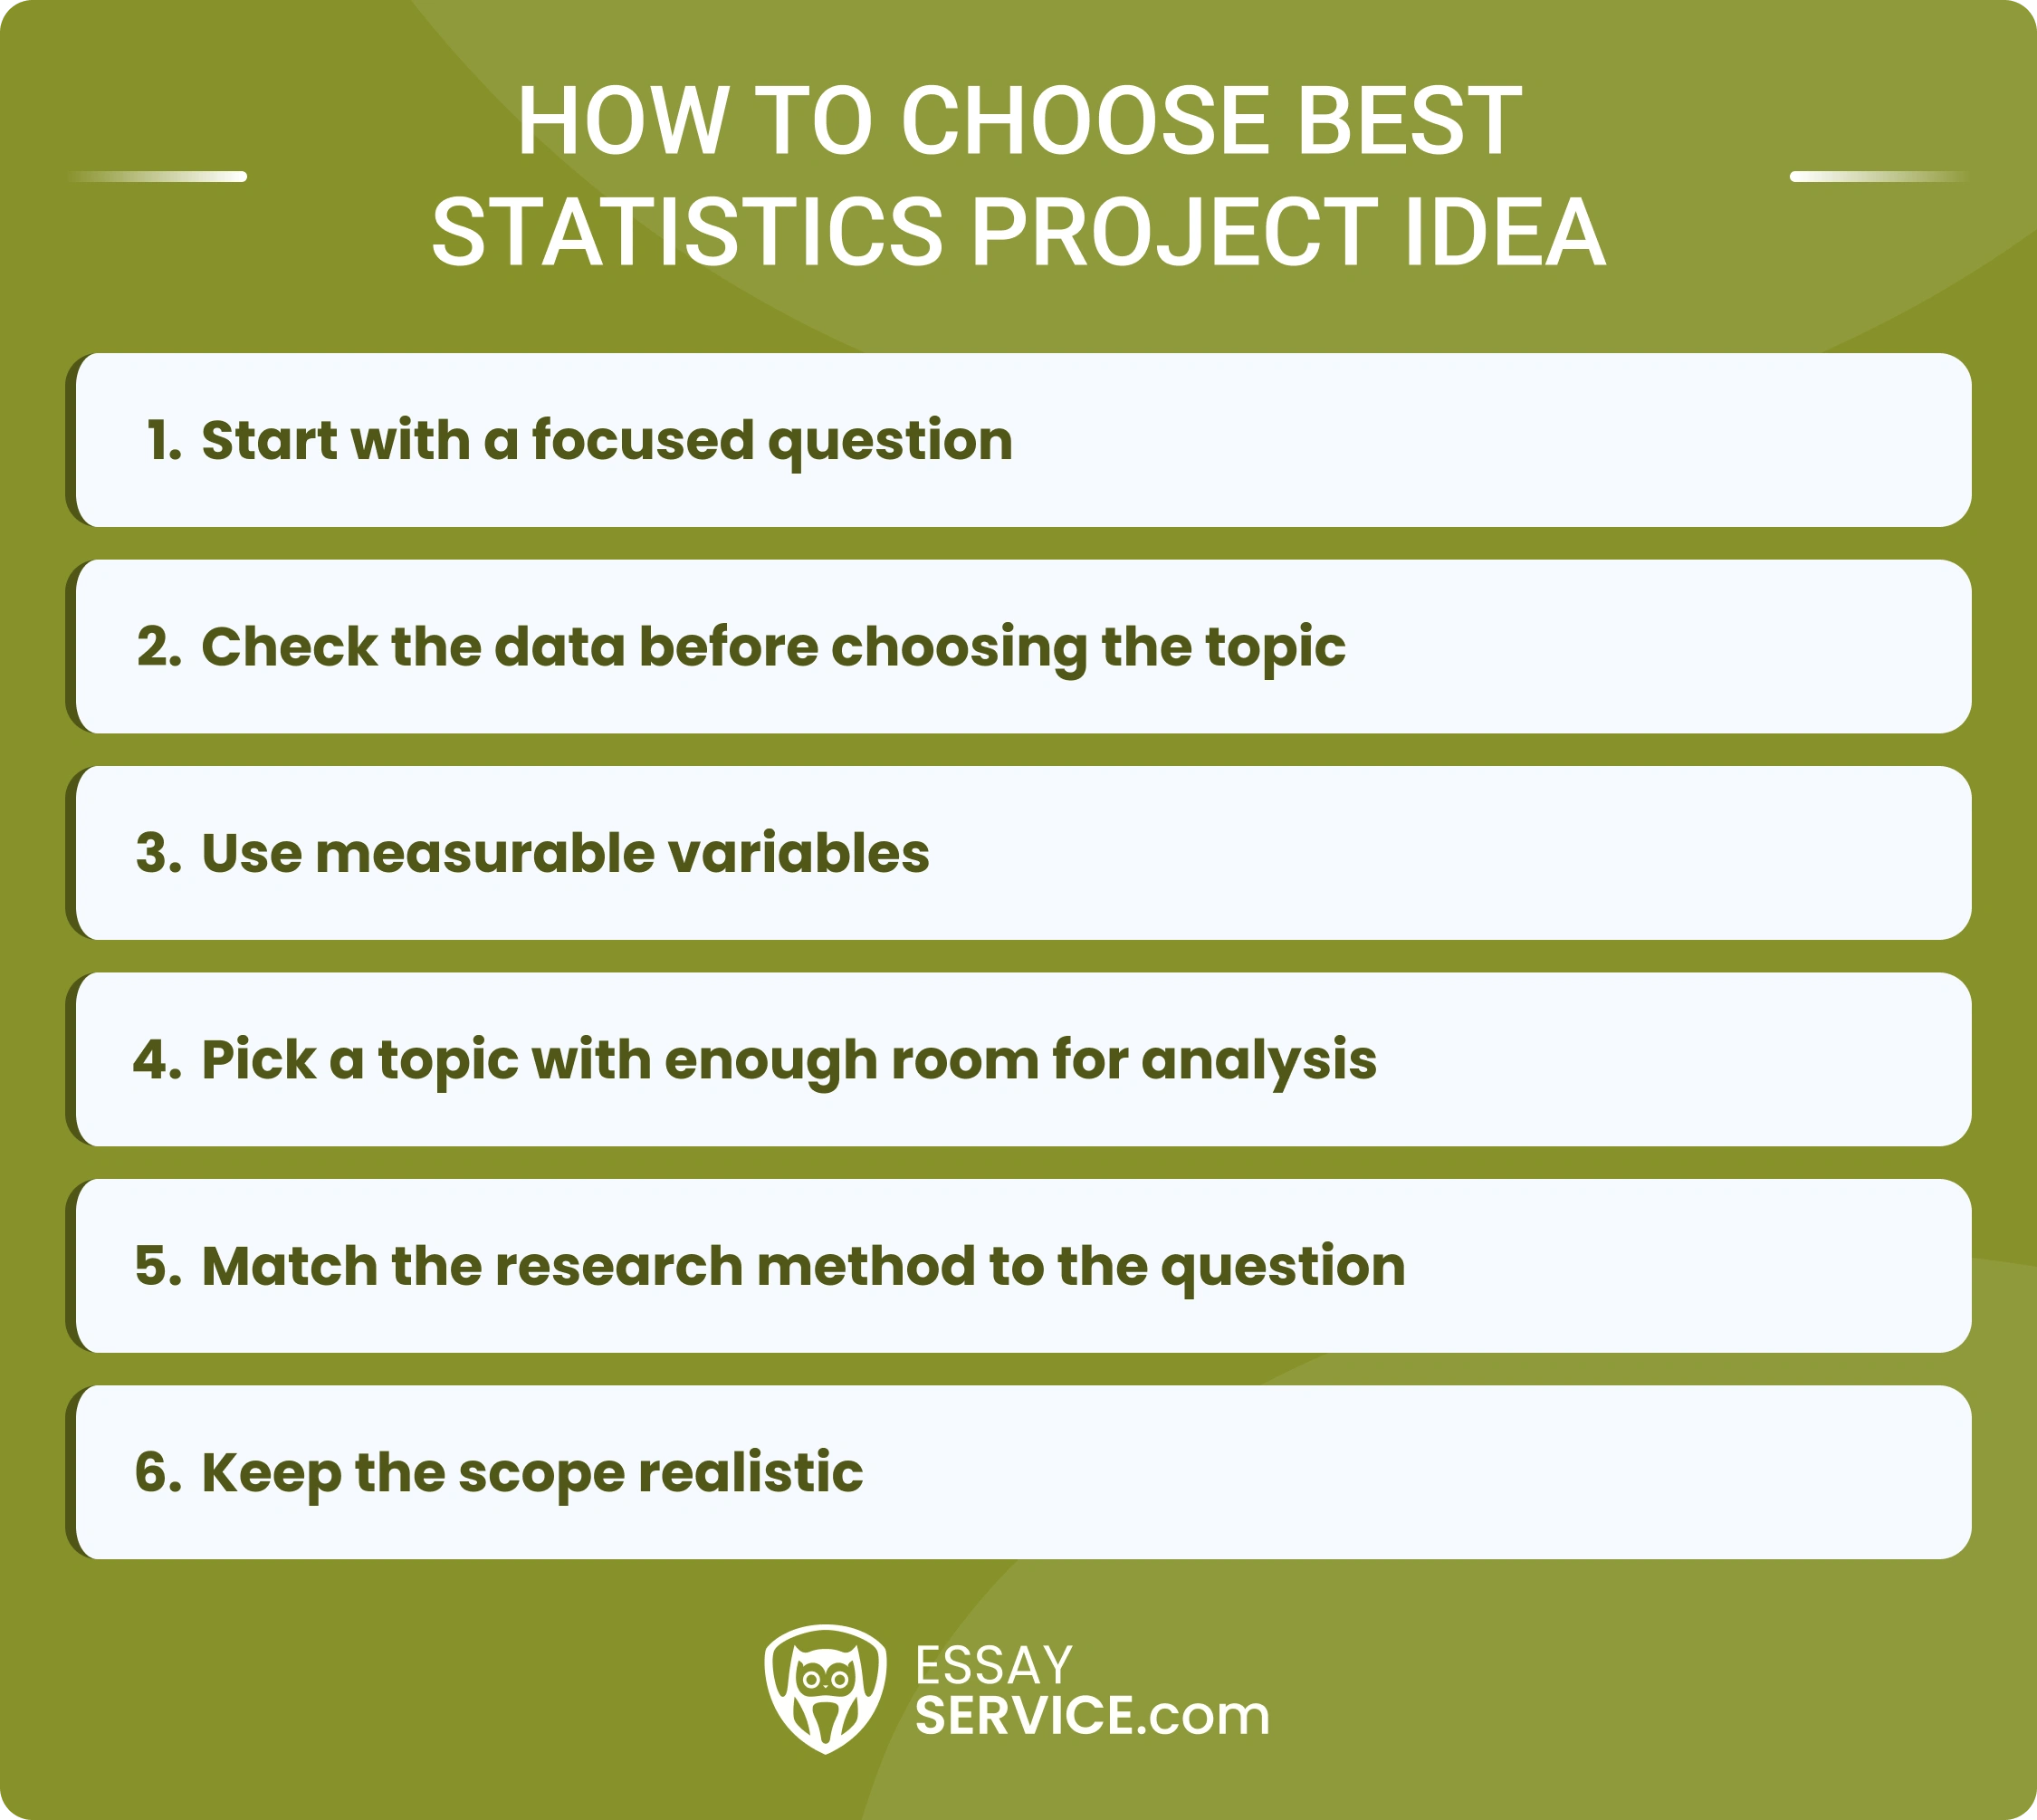
- Start with a focused question: “Restaurant prices” leaves too much open. “How do average lunch prices differ by neighborhood?” gives your statistics project a clear direction and a workable limit.
- Check the data before choosing the topic: Look for the numbers early, honestly. If the source feels thin, outdated, badly labeled, or suspicious, choose another idea before you lose hours trying to rescue it.
- Use measurable variables: Strong variables include price, time, distance, age, income, rating, frequency, temperature, cost, speed, and percentage. A vague trait can still work, although it needs a clear scale before it becomes useful.
- Pick a topic with enough room for analysis: A question with a one-sentence answer will probably lead to a weak project. The best statistics project ideas leave space for comparison, patterns, charts, interpretation, and a practical explanation.
- Match the method to the question: Averages help with basic comparisons. Correlation works when you need to study relationships. Regression can support prediction. Percentages help explain how values are distributed across groups.
- Keep the scope realistic: A smaller project can focus on one city, one dataset, one season, or one product category. A huge topic often becomes difficult because too many causes enter the analysis at once.
Reliable free data can make the whole process much easier, assuming you check the source before you build the project around it. Look here:
- U.S. Census Bureau: Useful for population, housing, income, and community data.
- Data.gov: Collects public datasets across health, transportation, climate, safety, and public services.
- Bureau of Labor Statistics: Works well for jobs, wages, prices, and employment trends.
- CDC: Provides public health datasets and other reliable public health data.
- World Bank Open Data: Helps with global comparisons across countries and regions.
- Kaggle: Useful for practice datasets, though the original source behind each dataset needs a careful look.
- Google Dataset Search: Helps you find datasets by topic, with the same rule: verify the source before you trust it.

Make the Draft Clear
Get help with planning, writing, editing, and citations when your assignment has too many loose parts.
Statistics Project Ideas for Different Level
Statistics projects should match the level of the course, because a topic that works well in high school may feel too small for college work. This section separates ideas by difficulty, data access, and the kind of analysis each topic can support.
Statistics Project Ideas High School
- Do local grocery prices change by neighborhood income level?
- Average screen brightness settings and battery drain across phone models
- How does temperature affect daily ice cream sales at small shops?
- Which household items show the biggest price difference across stores?
- Do movie ticket prices vary by city size?
- Morning traffic volume near supermarkets during weekdays and weekends
- How accurate are daily weather forecasts across one month?
- Which snack package sizes give buyers the lowest cost per ounce?
- Do public parks with more sports areas receive higher visitor ratings?
- Average wait times at different fast food chains during lunch hours
Statistics Project Ideas for College Students
- How do fuel prices relate to public transit ridership in major cities?
- Patterns in emergency room visits during extreme heat periods
- Do airline delays differ by airport size and season?
- The relationship between rent growth and local wage growth in metro areas
- How does restaurant's inspection score relate to online customer ratings?
- Regional differences in electric vehicle adoption rates
- Does unemployment change at the same pace across industries?
- Price movement patterns in grocery staples during inflation spikes
- How do crime report frequencies vary by time of day?
- County-level vaccination rates and access to nearby healthcare facilities
If you’re interested in the dynamics within the higher education sector, understand the concept of sophomore slump and what drives 25% of students to drop out as early as the second year.
Best Statistics Project Ideas
The best statistics project topics have enough structure for analysis and enough room for interpretation. The ideas below cover easier projects, AP-level work, and statistical analysis topics that can support deeper testing.
Easy Statistics Project Ideas
- Which cereal brands offer the lowest cost per serving?
- Do coffee shop prices differ by distance from downtown areas?
- Average delivery fees across food apps in one city
- How often do grocery stores discount fresh fruit during one month?
- Which streaming platforms have the highest average user ratings?
- Do gas prices vary more on highways than in residential areas?
- Average checkout wait times at supermarkets during peak hours
- How does package weight affect shipping cost across carriers?
- Which local gyms offer the best price per monthly visit?
- Daily step counts and weather conditions across a two-week period
AP Statistics Project Ideas
- Is there a significant difference in home energy use across seasons?
- How strongly does household income predict internet access by county?
- Do larger airports have more predictable departure delay patterns?
- Testing the link between air quality index and hospital asthma visits
- Confidence intervals for average grocery spending across household sizes
- How much does rainfall influence daily bike-share usage?
- Hypothesis test on price differences between name-brand and store-brand items
- Does city population size relate to average commute duration?
- Sampling bias in online product ratings across retail websites
- Regression analysis of temperature and electricity demand
Statistical Analysis Project Ideas
- What factors predict higher home insurance costs across counties?
- Time-series analysis of monthly food price changes
- Does access to public transportation relate to employment rates?
- Clustering cities by cost of living and average income
- How accurately can past rainfall predict reservoir levels?
- Comparing hospital readmission rates across regions
- Logistic regression on customer churn using subscription data
- Seasonal patterns in tourism demand across coastal cities
- What explains variation in used car prices across brands?
- Correlation between walkability scores and local business density
Browse our article where we list expository essay topics hand-picked for your academic projects.
Survey Topics for Statistics Project
- How does age group affect preference for self-checkout versus cashier checkout?
- Comparing reported monthly subscription spending across income brackets
- Which product label factor has the strongest effect on snack choice?
- How does wait time length change customer satisfaction ratings?
- Relationship between household size and weekly grocery spending
- Do people with longer commutes report higher weekly fuel costs?
- Measuring how often shoppers compare unit prices before purchase
- What percentage of local residents support bike lane expansion by age group?
- Comparing reusable bag use across weekly and occasional grocery shoppers
- How does review score influence willingness to book a local service?
Probability and Statistics Project Ideas
- What is the probability that a seven-day weather forecast correctly predicts rainfall?
- Comparing observed and expected outcomes in 500 dice rolls
- How often do underdog teams win when the point spread is under five?
- Probability distribution of candy colors in randomly selected packages
- Testing if coin toss results differ significantly from a 50/50 split
- Expected wait time differences across three coffee shop service lines
- How likely is a flight delay during morning, afternoon, and evening departures?
- Comparing predicted rain probability with actual rainfall across 30 days
- Calculating the probability of repeat defects in small product samples
- What is the chance of drawing two matching colors in repeated candy trials?
Quantitative Statistics Project Ideas
- How strongly does apartment size predict monthly rent in one city?
- Comparing mean delivery fees across three food delivery apps
- Relationship between daily temperature and household electricity use
- Measuring price variance in common grocery staples across four stores
- How does vehicle type affect estimated monthly fuel cost?
- Regression analysis of city population and average commute duration
- Comparing median repair costs across smartphone brands
- How does store rating correlate with average product price?
- Tracking weekly price changes in eggs, bread, milk, and coffee
- Does package size reduce cost per ounce across snack brands?
While you’re at it, you should also learn the difference between qualitative vs quantitative research and data.
Community Studies Statistics Project Ideas
- How does park distance relate to weekly visitor counts by neighborhood?
- Comparing library attendance across weekdays, weekends, and seasons
- Relationship between streetlight density and reported nighttime accidents
- How does bus stop distance affect public transit use in residential areas?
- Measuring grocery store access by neighborhood income level
- Comparing noise complaint frequency across time blocks and districts
- Does sidewalk quality correlate with pedestrian activity counts?
- Household recycling rates across apartment buildings and single-family homes
- Estimating community event participation by age group and event type
- How do housing prices change within one mile of public facilities?
Psychology Statistics Project Ideas
- How does sleep duration correlate with self-reported stress scores?
- Comparing task completion time under quiet and background-noise conditions
- Relationship between room lighting level and comfort rating
- How does time pressure affect risk-taking in simple choice tasks?
- Measuring recall accuracy after handwritten notes and typed notes
- Does color choice influence product preference ratings?
- Comparing frustration scores after short, medium, and long waits
- Correlation between daily screen time and attention-test performance
- How does music tempo affect self-reported mood score?
- Testing choice overload through satisfaction ratings after different menu sizes
Education Statistics Project Ideas
- How does class size correlate with average test scores by district?
- Comparing attendance rates across school months and grade levels
- Relationship between homework completion percentage and exam performance
- How does school start time relate to late-arrival frequency?
- Measuring graduation rate differences across public school districts
- Comparing math score growth among different tutoring frequency groups
- Does library access predict reading score averages by school?
- Course enrollment trends across science, arts, and technical subjects
- How does digital textbook use relate to assignment submission rates?
- Comparing school lunch participation with daily attendance percentages
Business Statistics Project Topics
- How strongly do customer ratings predict repeat purchase rates?
- Comparing the average order value before and after seasonal promotions
- Relationship between website load time and checkout conversion rate
- How does response time affect customer satisfaction scores?
- Measuring cart abandonment rates across product price ranges
- Do loyalty program members purchase more often than non-members?
- Comparing complaint frequency across product categories and months
- Regression analysis of discount percentage and sales volume
- How does inventory shortage frequency affect monthly revenue?
- Weekday versus weekend sales patterns across retail locations
Economics Statistics Project Ideas
- How does the inflation rate relate to average grocery spending by income group?
- Comparing unemployment rates and consumer confidence across quarters
- Relationship between minimum wage changes and restaurant menu prices
- How do mortgage rates affect monthly home loan applications?
- Measuring rent growth against wage growth in metro areas
- Comparing regional fuel price changes across twelve months
- Gini coefficient changes within one state across recent years
- How does tourism volume correlate with local hotel price averages?
- Relationship between population growth and housing affordability index
- Exchange rate changes and import price movement across product categories
Technology Statistics Project Ideas
- Does smartphone age predict shorter average battery life?
- Comparing app crash rates across three operating system versions
- Internet speed as a predictor of video buffering time
- How much does screen size influence mobile shopping session length?
- Password length patterns across age groups
- Are delayed software updates linked to more device performance complaints?
- Laptop price and processor benchmark score regression analysis
- User drop-off rates after slow login attempts
- Which cloud storage provider offers the lowest cost per gigabyte?
- Notification frequency and daily phone pickup counts
Healthcare Statistics Project Ideas
- Appointment wait time as a predictor of patient satisfaction scores
- How do hospital readmission rates differ across age groups?
- Air quality index and asthma-related emergency visits by month
- County income level and vaccination rate differences
- Which local pharmacy has the highest average prescription cost?
- Missed appointment frequency by clinic distance
- Daily step count averages across age groups
- Does sleep duration correlate with resting heart rate?
- Seasonal temperature changes and flu case counts
- Urgent care wait time differences by weekday
Environmental Statistics Project Ideas
- Rainfall amount and reservoir level changes across one year
- Do traffic-heavy areas have higher average air pollution levels?
- Tree coverage as a predictor of neighborhood temperature
- Recycling rate differences across household types
- Monthly plastic waste volume in selected public spaces
- Does beach visitor count predict litter collection weight?
- Seasonal energy use patterns in residential buildings
- Temperature changes and daily water consumption
- How much does wildfire smoke raise regional air quality index readings?
- Local bird sighting counts across spring, summer, fall, and winter
Demographic Statistics Project Ideas
- Median age differences across urban and rural counties
- How does household income distribution vary by neighborhood type?
- Population density and average rent price correlation
- Birth rate changes across selected regions over ten years
- County population change as a measure of migration patterns
- Does education level correlate with median household income?
- Age-group proportions in growing cities versus shrinking cities
- Population size and public transit use regression analysis
- Which housing type has the highest average household size?
- Senior population share changes across states
Entertainment Statistics Project Ideas
- Movie rating scores and box office revenue correlation
- How do streaming prices compare with the total content library size?
- Episode length as a predictor of viewer rating by TV genre
- Release month and opening weekend movie earnings
- Song duration trends across popular music charts
- Do critic scores predict audience rating averages?
- Video game price differences and user review scores
- Concert ticket price and venue capacity regression analysis
- How often do sequels earn more than original films?
- Weekly streaming chart data and genre popularity changes
Fun Statistics Project Ideas
- Pizza topping choices by age group
- How do coffee order prices differ across local cafés?
- Pet type and monthly pet-care spending correlation
- Accuracy rates for estimating one minute without a timer
- Snack preference differences across movie genres
- Do board game ratings change with average play time?
- Average word length in popular song titles by decade
- Ice cream flavor choices across seasons
- Car color frequency counts in parking lots
- Does horoscope sign distribution match the expected probability in a sample?
Fix the Rough Draft
Work with writing support that helps tighten the argument, clean up weak sections, and prepare the paper for submission.
Statistics Project Ideas with Examples
Examples of statistics projects make the whole assignment easier to understand because they show how a topic turns into actual analysis. A usable project needs a focused question, a believable data source, and methods that fit the numbers. The examples below show that structure in practice.
- Grocery Price Differences Across Store Types
- Project focus: Analyze how prices for the same basic grocery items differ across supermarkets, discount stores, and small local markets.
- Data source: Weekly price records for selected items such as eggs, bread, rice, apples, coffee, and milk across several nearby stores.
- Methods used: Mean comparison, percentage difference, standard deviation, and simple data visualization.
- Outcome: Shows which store type has higher average prices, which items vary most, and where price differences are too small to mean much.
- Weather Forecast Accuracy Across One Month
- Project focus: Test how accurately a weather app predicts temperature, rainfall, and wind speed during a 30-day period.
- Data source: Daily forecast records collected at the same time each morning, then compared with actual weather reports.
- Methods used: Error calculation, mean absolute error, frequency tables, and comparison charts.
- Outcome: Identifies which weather measure is predicted most accurately and where the forecast tends to miss by larger margins.
- Customer Ratings and Delivery Time in Local Restaurants
- Project focus: Examine whether restaurants with shorter delivery times also receive higher customer ratings.
- Data source: Public delivery app data, including estimated delivery time, actual delivery time when available, restaurant category, price range, and customer rating.
- Methods used: Correlation analysis, scatterplots, descriptive statistics, and grouped comparison by restaurant type.
- Outcome: Shows if delivery speed has a measurable relationship with ratings, while also separating fast service patterns by food category and price level.
If you’ve already read our article but are still unsure how to go about writing the project itself, just reach out to us and say, ‘Do my statistics homework for me.’
Final Thoughts
Good statistics project ideas come from questions that can be measured, tested, and explained without forcing the data. A strong topic needs reliable sources, clear variables, realistic scope, and a method that fits the question. Once those pieces line up, the project becomes easier to structure, analyze, and present with actual meaning
Frequently Asked Questions
What Is the Best Topic for a Statistics Project?
What Are Some Statistics Project Ideas?
How to Choose a Good Statistics Project Topic?

Essie isn’t just an educator with a Bachelor’s in English: she’s passionate about writing. She uses her experience in grading papers to write comprehensive guides for our blog.
- Millard, R., Freeman, W., & York, C. (n.d.). Activities and Projects for the Freeman Statistics Series. Retrieved June 1, 2026, from https://www.uwosh.edu/faculty_staff/benzaid/documents/189S2007/Projects.pdf
- Admin. (2012, February 29). Simply Statistics: Statistics project ideas for students. Simply Statistics. https://simplystatistics.org/posts/2012-02-29-statistics-project-ideas-for-students/


New posts to your inbox
Your submission has been received!